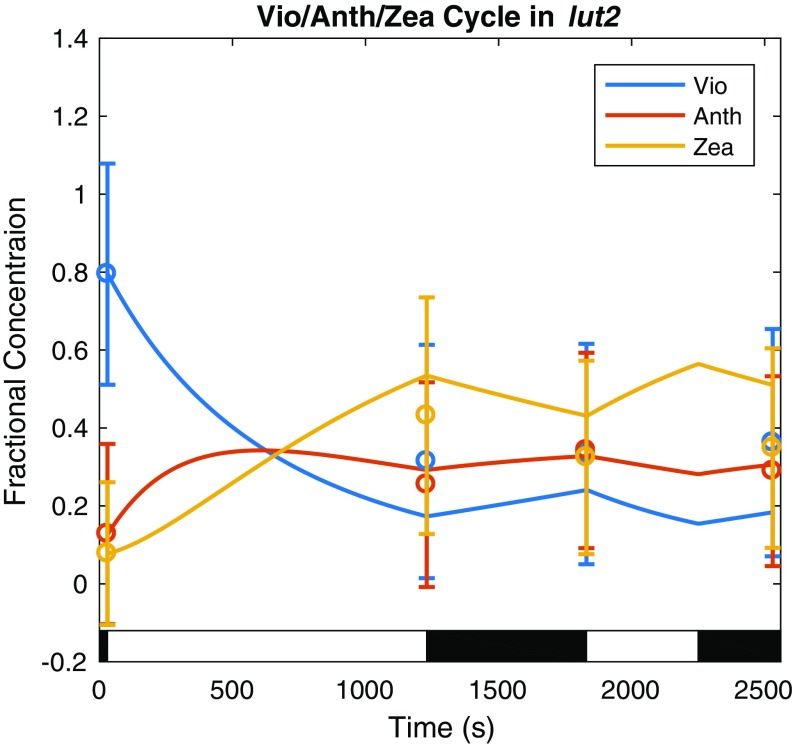
Fig. S5.
Dynamics of the lut2 VAZ cycle in response to the light acclimation scheme shown in the light and dark bars superimposed on the plot fit to HPLC data are shown here. The data are represented by a fit of the fractional concentration of the available pool of violaxanthin (Vio), antheraxanthin (Anth), and zeaxanthin (Zea) to the available pool of xanthophylls determined from analysis of HPLC measurements (Materials and Methods) at four time points (circles with error bars denoting SD for n = 8) using a first-order kinetic model with a ∆pH-dependent rate of deepoxidation (solid lines).

