Fig. S2.
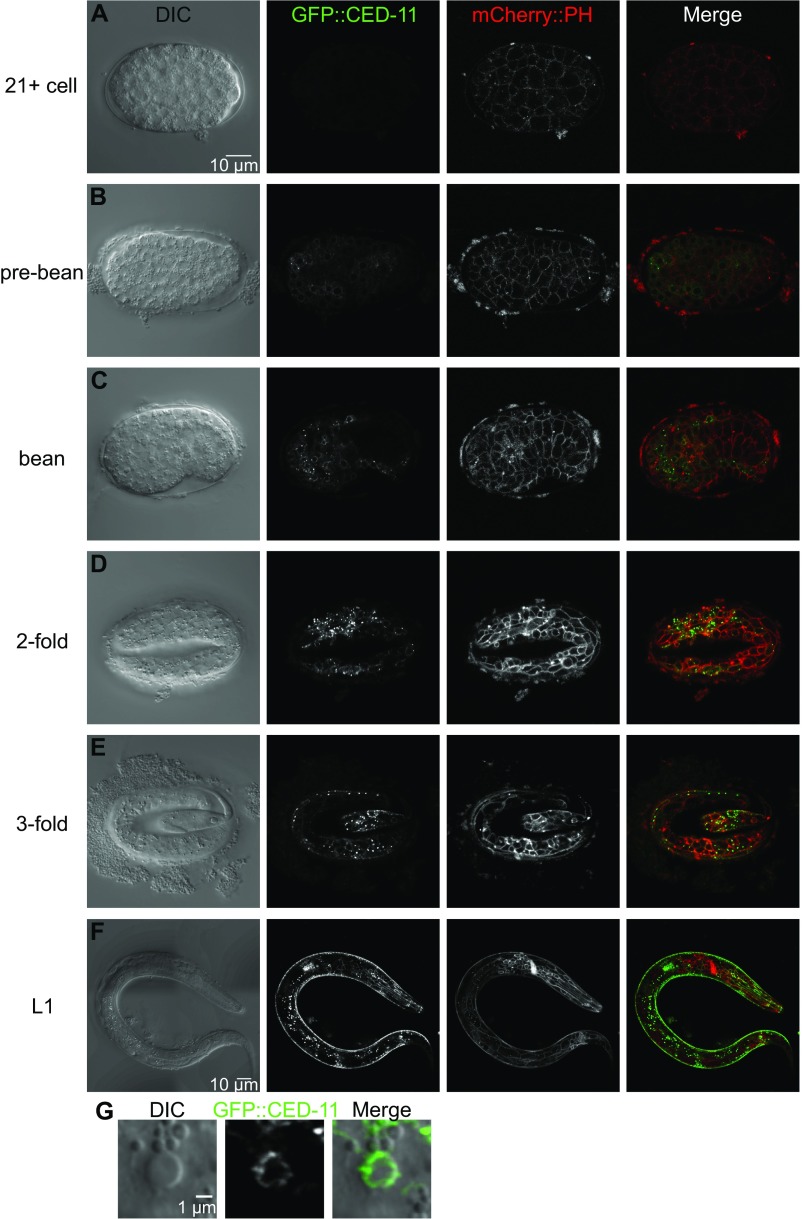
Pced-11::gfp::ced-11 expression. (A–F) GFP::CED-11 expression pattern in embryos at the indicated stages (A–E) and in a larva (F). mCherry::PH localizes to the plasma membrane. mCherry images were taken with different gains to enhance visualization. GFP images in A–E were taken with the same gain to allow comparison between embryos. (Scale bar: 10 µm for all embryos.) The GFP gain in F is higher than in the images of embryos to enhance visualization. (G) DIC image of an apoptotic cell with GFP::CED-11 expression.

