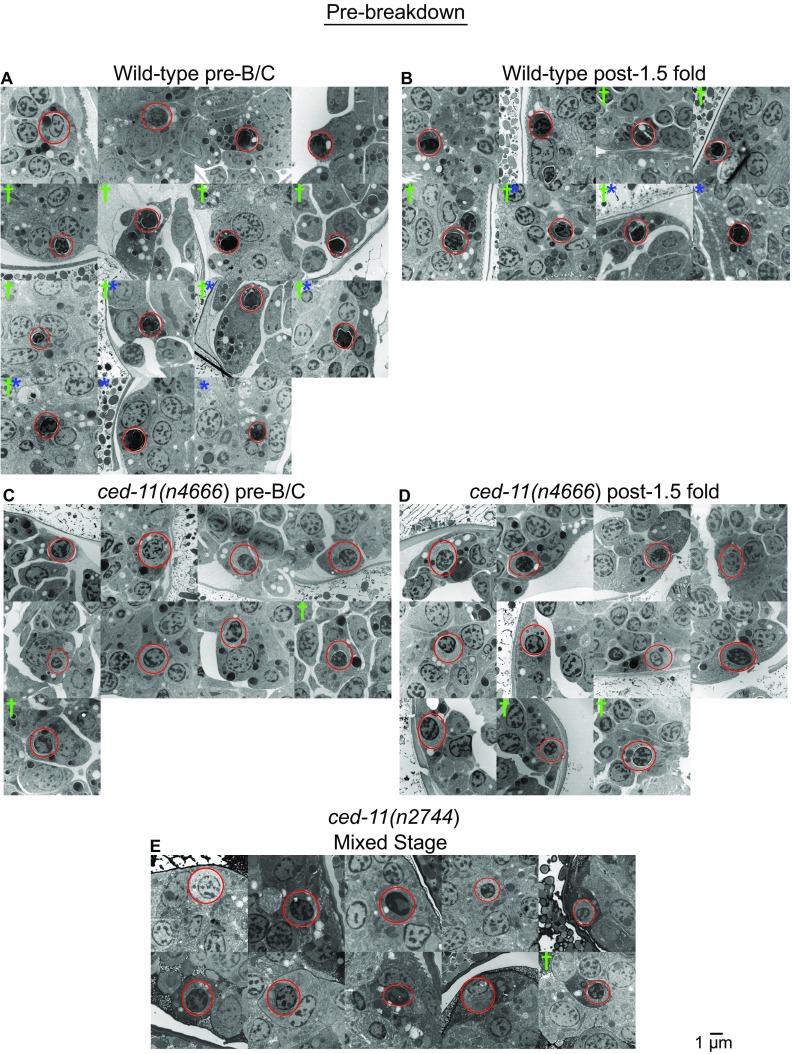
Fig. S3.
Electron micrographs of prebreakdown apoptotic cells in embryos of indicated genotypes and stages. (A) Wild-type pre-bean and comma (B/C) embryos. (B) Wild-type 1.5-fold–stage to threefold-stage embryos. (C) ced-11(n4666) pre-B/C embryos. (D) ced-11(n4666) 1.5-fold–stage to threefold-stage embryos. (E) ced-11(n2744) mixed-stage embryos. Asterisks mark apoptotic cells with a wrinkled nucleus. Daggers mark an apoptotic cell with separation of the nucleus and cytoplasm. Red circles mark apoptotic cells.

