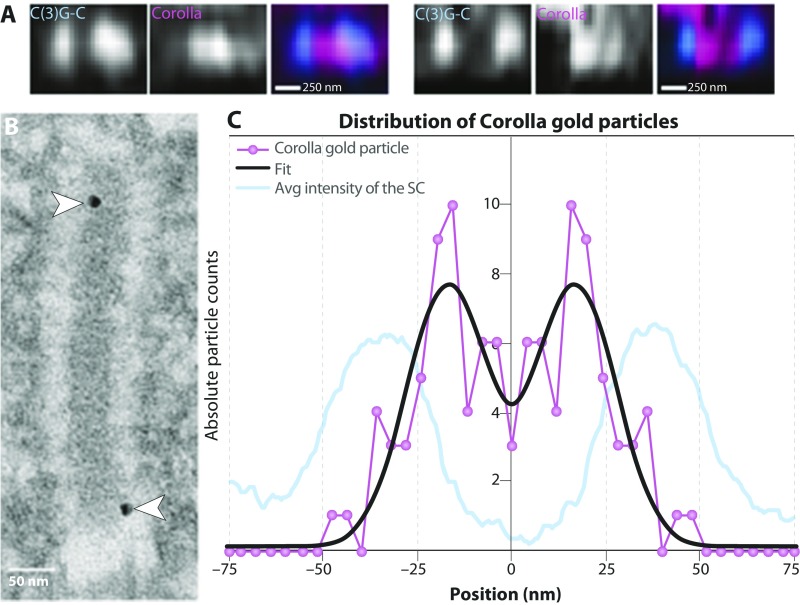
Fig. S5.
Analysis of the distribution of Corolla in xy. (A) Averaged xz images of C(3)G C termini (blue) and Corolla (pink) from type 1 SC. (Scale bars represent expanded distances.) (B) Immuno-EM image of Corolla labeled with gold particles. Arrowheads mark the positions of the gold particles. (C) Histogram of the distribution of Corolla gold particles (n = 51) based on immuno-EM. Overlaid on the histogram is the average intensity of the SC to illustrate the locations of the LEs in relation to the position of the Corolla gold particles. This average intensity is determined by drawing a line profile across the SC in the EM images and then measuring the intensity of the image across that line. These intensity measurements are then averaged together to give the average intensity of the SC.

