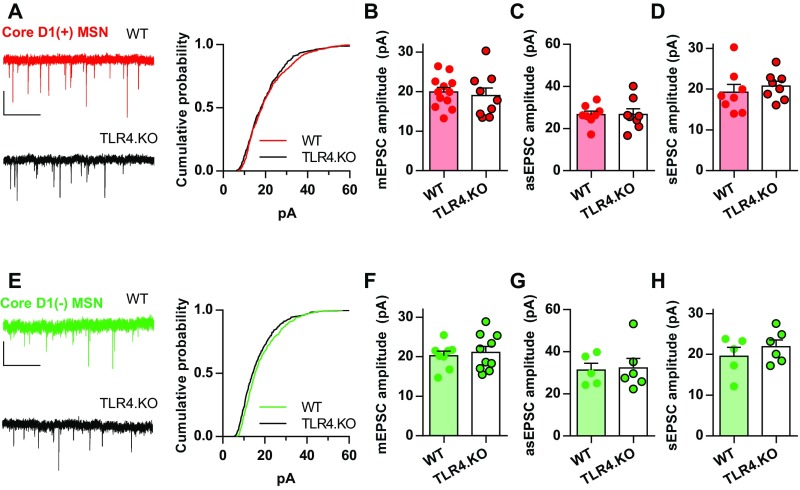
Fig. S1.
No significant differences in quantal AMPAR transmission onto NAc core TLR4.KO MSNs. (A, Left) Representative traces of mEPSCs from of WT (red) and TLR4.KO (black) D1(+) MSNs. (Right) Cumulative probability plot of mEPSC amplitudes from D1(+) MSNs. (B) Summary plot of mEPSC amplitudes. (C) Summary plot of asEPSC amplitudes from D1(+) MSNs. (D) Summary plot of sEPSC amplitudes. (E–H) Representative traces, mEPSC amplitude cumulative probability and summary plot, asEPSC amplitude summary plot, and sEPSC amplitude summary plot for D1(−) MSNs (WT: green; TLR4.KO: black). All recordings were taken in the presence of picrotoxin (50 μM). mEPSCs were taken in the presence of tetrodotoxin (1 μM). asEPSCs and sEPSCs were recorded using low-Ca2+ ACSF with Sr2+. n/N = 5–12 cells from three to five animals per group. (Scale bars: 20 pA; 1 s.) P > 0.05 for all comparisons, unpaired t test.

