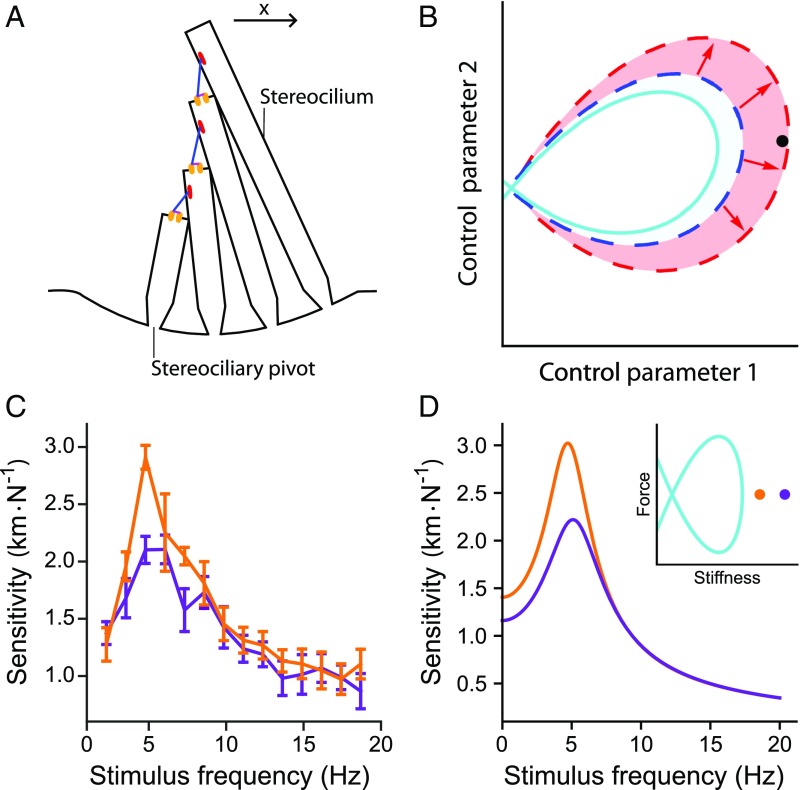
Fig. 1.
The sensitivity of a hair bundle to sinusoidal stimulation. () The hair bundle comprises a set of rigid, cylindrical stereocilia that protrude from the apical surface of the hair cell. Deflection of the hair bundle in the positive direction (arrow) pivots the stereocilia about their bases. This motion increases tension in tip links (blue) that run between neighboring stereocilia, which in turn opens mechanoelectrical transduction channels (orange). () A state diagram depicts the behavior of a hair bundle as a function of two control parameters. A line of Hopf bifurcations (solid, cyan) encircles the set of parameter values for which spontaneous oscillations occur. The entire shaded area marks the quiescent region in which the hair bundle possesses a sensitivity exceeding a specific threshold. The dashed curves mark the boundary of the high-performance region when the homeostatic mechanism is either inactive (blue) or active (red). At the black operating point, for example, the bundle’s sensitivity is poor when homeostasis is off, but above threshold when homeostasis is operational. () Tuning curves for an actual hair bundle from the bullfrog’s sacculus commanded to operate at stiffness values closer to (orange; 900 Nm-1) or farther from (purple; 1,000 Nm-1) the self-oscillation region. Sensitivity is defined to be the amplitude of the hair bundle’s phase-locked response at the stimulus frequency divided by the amplitude of the sinusoidal driving force. The control parameter is the bundle’s load stiffness, and this bundle traverses a Hopf bifurcation at 710 Nm-1 (SI Appendix, section 1). Error bars represent the standard errors of the means of four repeated measurements on the same hair bundle. Stimuli were delivered to the hair bundle directly by using a glass fiber (Materials and Methods and SI Appendix, section 1). () Sensitivity of a hair bundle model close to (orange; 750 Nm-1) or farther from (purple; 900 Nm-1) a Hopf bifurcation. D, Inset schematically depicts the model’s state diagram, whose axes are the size of a constant force applied to the bundle and the combined stiffness of the bundle and its overlying load; only positive stiffness values are represented. The Hopf bifurcation curve (cyan) encloses operating points at which the bundle oscillates spontaneously. These tuning curves were obtained from model II without homeostasis (Eqs. 4 and 5) with the parameter values listed in SI Appendix, Table S2, except m-1, m-1, , and pN. For this set of parameter values, a Hopf bifurcation occurs at a static deflection, or constant force, of 0 pN and a load stiffness of 248 Nm-1.

