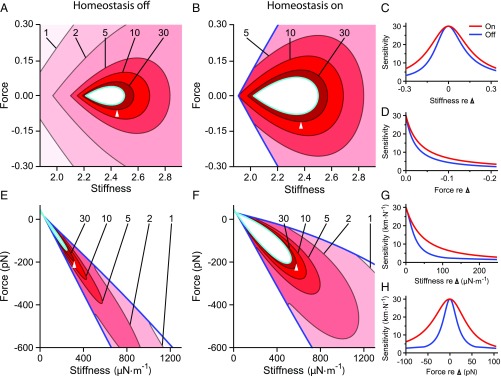
Fig. 2.
Homeostasis increases the robustness of a hair bundle’s sensitivity. ( and ) Sensitivity as a function of constant force and stiffness for model I when homeostasis is off () or on (). Darker shades of red indicate larger values of the peak sensitivity . Contours are labeled by their respective peak sensitivity values. The Hopf bifurcation curve is colored cyan, and the blue curve marks the boundary of the underdamped region. Homeostasis enhances the robustness of the hair bundle’s sensitivity to small-amplitude sinusoidal signals by expanding the areas enclosed by the sensitivity contours. ( and ) The peak sensitivities along a horizontal () or vertical () slice through the state diagram when homeostasis is inactive (blue) or active (red). These curves correspond to slices through the reference operating points indicated in and , respectively (apices of white triangles). The peak sensitivity is larger and changes more slowly along these transects when homeostasis is active. (E–H) The results for model II are portrayed as for A–D. The contour labels in and bear units of kmN-1. All parameter values are listed in SI Appendix, Tables S1 and S2. Additional bifurcation lines that occur in these regions of the state diagrams are not shown (SI Appendix, sections 8 and 9).

