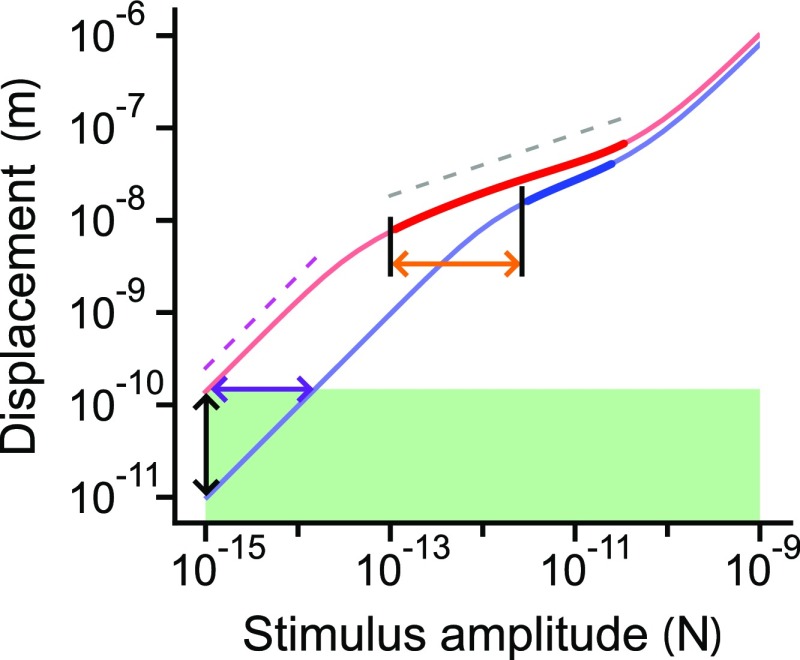
Fig. 4.
Increasing the compressive range broadens a bundle’s dynamic range. The responses of model II, absent homeostasis, to periodic stimulation at the resonant frequency are shown for operating points closer to (red) and farther from (blue) the self-oscillation region. The response , in which is the slope of the curves in the doubly logarithmic plot. Thin portions of the curves have slopes between 1/2 and 1, whereas thick portions bear slopes between 0 and 1/2. For comparison, the relations (dashed magenta line) and (dashed gray line) are shown. The horizontal span of the thick part of each curve defines that operating point’s compressive range. Points on the curves above the area shaded green exceed a threshold in displacement. The dynamic range of the red curve equals the width of the green rectangle; the dynamic range of the blue curve is smaller by one order of magnitude (purple arrow). This difference stems from the red curve’s larger compressive range (orange arrow). Extending the dynamic range renders the bundle more sensitive to low-amplitude stimuli (blackarrow).

