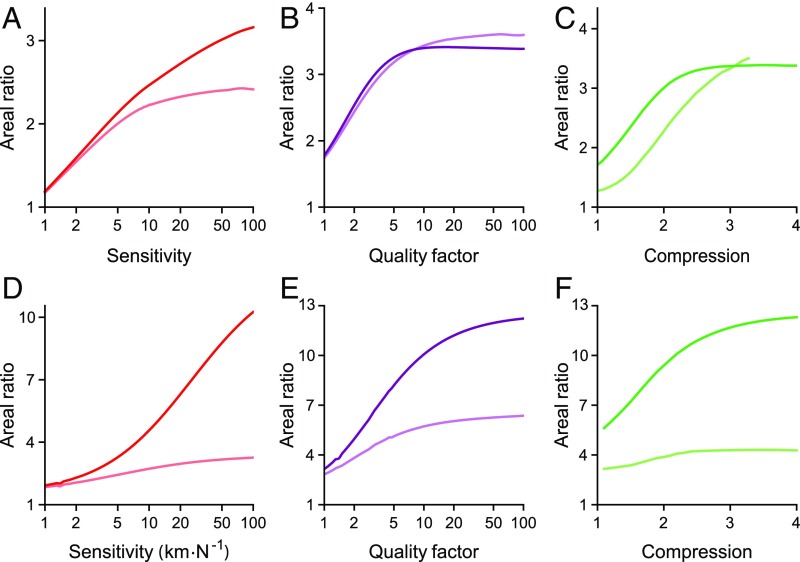
Fig. 6.
Quantification of robustness enhancement. The values reported represent the ratios of areas enclosed by contours in the homeostasis on state diagrams to areas bounded by contours in the homeostasis off state diagrams. The oscillatory region of the state diagram is either included (darker) or excluded (lighter). – Areal ratios for model I: peak sensitivity (), quality factor , and compressive range . – Areal ratios for model II: peak sensitivity (), quality factor , and compressive range . The entire areas enclosed by some contours are not shown in Figs. 2, 3, and 5, but are included in our calculation of areal ratios.

