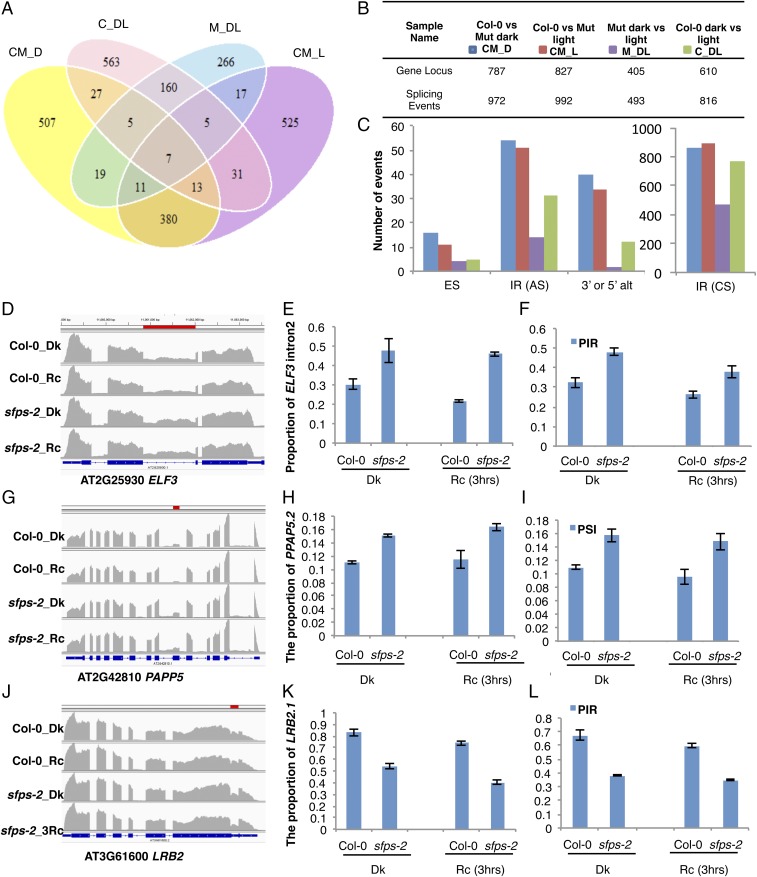
Fig. 5.
SFPS controls pre-mRNA splicing of the Arabidopsis transcriptome. (A) Venn diagram of the number of genes that displayed altered AS pattern in Col-0 vs. Mut dark (CM_D), Col-0 vs. Mut 3 h Rc (CM_L), Col-0 dark vs. 3 h Rc (C_DL), and Mut dark vs. 3 h Rc (M_DL) respectively. P < 0.05, FDR <0.05 and PSI or PIR change is larger than 3%. (B) Summary table giving number of genes with altered AS patterns. (C) Bar graph shows the number of different types of AS (alternative splicing) events in four groups of comparisons. (D–L) Confirmation of RNA-seq data by RT-qPCR for selected light signaling genes. (D, G, and J) Integrative Genomics Viewer shows alternative splicing defects detected by RNA-seq between Col-0 and sfps-2. Red bar indicates the position of AS events in the genes. (E, H, and K) RT-qPCR validation of RNA-seq data. Total RNA was extracted from Col-0 and sfps-2 seedlings grown in the dark or under Rc (3 h, 7 μmol⋅m−2⋅s−1) light, respectively. AS patterns of the light signaling genes, ELF3, PAPP5, and LRB2 are expressed as the proportion of specific isoforms in the total transcripts of the same gene. PP2A was used as an internal control. Each bar is the mean ± SEM (n = 3 independent biological repeats, and each biological repeat include three technical repeats). (F, I, and L) AS patterns indicated by RNA-seq. PSI and PIR are calculated according to formulas in Materials and Methods (n = 3 independent biological repeats). CS, constitutive splicing; Dk, dark; ES, exon skipping; IR, intron retention; Rc, continuous red.

