Fig. 6.
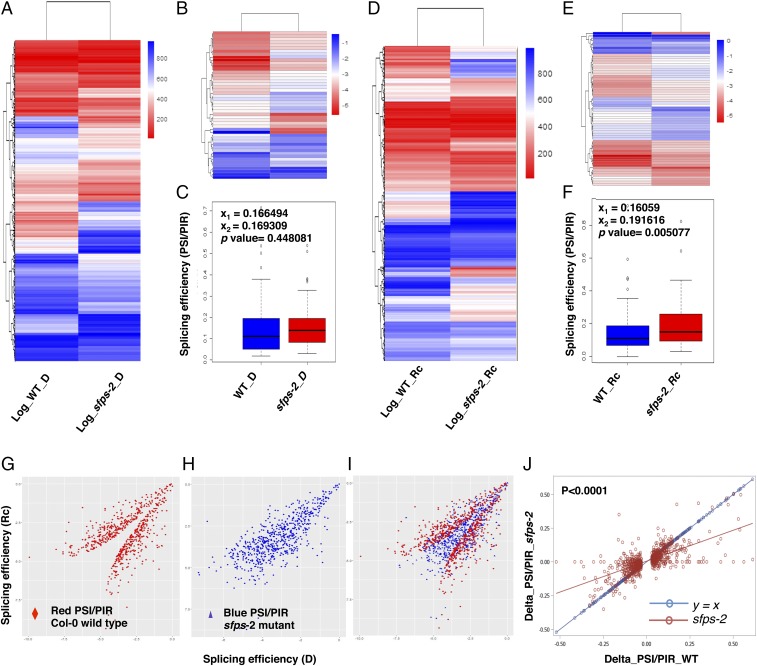
SFPS mediates light regulation of pre-mRNA splicing. Heat maps of genome-wide pre-mRNA splicing profiling, based on log2 PSI, PIR of Col-0 and sfps-2 dark (A) and light samples (D), respectively. Hierarchical clustering was performed on genes with altered pre-mRNA splicing pattern between Col-0 and sfps-2. Blue color, higher log2 PSI, PIR; red color, lower log2 PSI, PIR. red light intensity used was 7 μmol⋅m−2⋅s−1. (B and E) Heat maps of quantified pre-mRNA splicing profile of the genes related to the light-induced phenotype of sfps mutant. Gene lists are included in Dataset S2, I. (C and F) Box plots of PSI and PIR for the genes related to the phenotype in dark and Rc conditions. (G and H) Scatter plots of splicing efficiency for light-regulated splicing events in wild type (G) and sfps-2 (H). X-axis is the splicing efficiency (log2 PSI, PIR) in the dark. y axis is the splicing efficiency (log2 PSI, PIR) after light treatment. (I) Overlay of G and H. The scatter plot was generated on the basis of the 816 differentially spliced events detected in wild type. (J) Linear regression analyses of the splicing efficiency changes (Delta_PSI, PIR = PSI, PIR_Dark – PSI, PIR_Light) between the wild type and sfps-2 mutant in response to light. The differentially spliced events that were used to generate this analysis are described in G–I. The linear regression model for sfps-2 P < 0.0001, slope= 0.46, adjusted R2 = 0.45. Red line indicates linear regression for sfps-2; blue line indicates the control y = x. The splicing efficiency changes in sfps-2 are significantly different from y = x (P < 0.0001). D, dark; Rc, continuous red.

