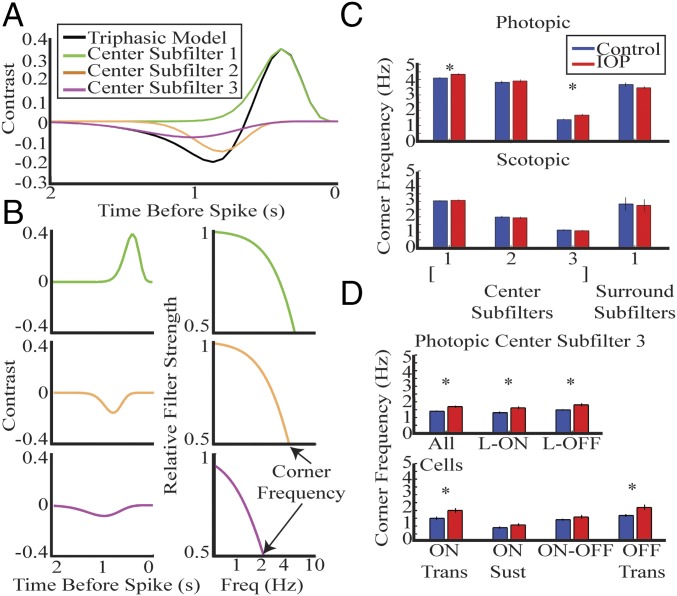
Fig. 4.
RGCs accelerate temporal tuning in IOP mice. (A) Triphasic center trace is divided into three subcomponents. The three subcomponents are indicated by different colors and are referred to as center subfilters 1, 2, and 3. (B) Each subfilter is shown in a separate plot in the time domain in column 1, and in the frequency domain in column 2. The corner frequency can be identified for each cell by the frequency at which there is 50% attenuation. (C) The bar plot compares mean corner frequency for each subfilter in photopic (Upper) and scotopic (Lower) conditions. Error bar indicates 1 SE. (D) Mean corner frequency of center subfilter 3 is compared for each subclass. There is a significant increase for most classes. *P < 0.05.

