Fig. 1.
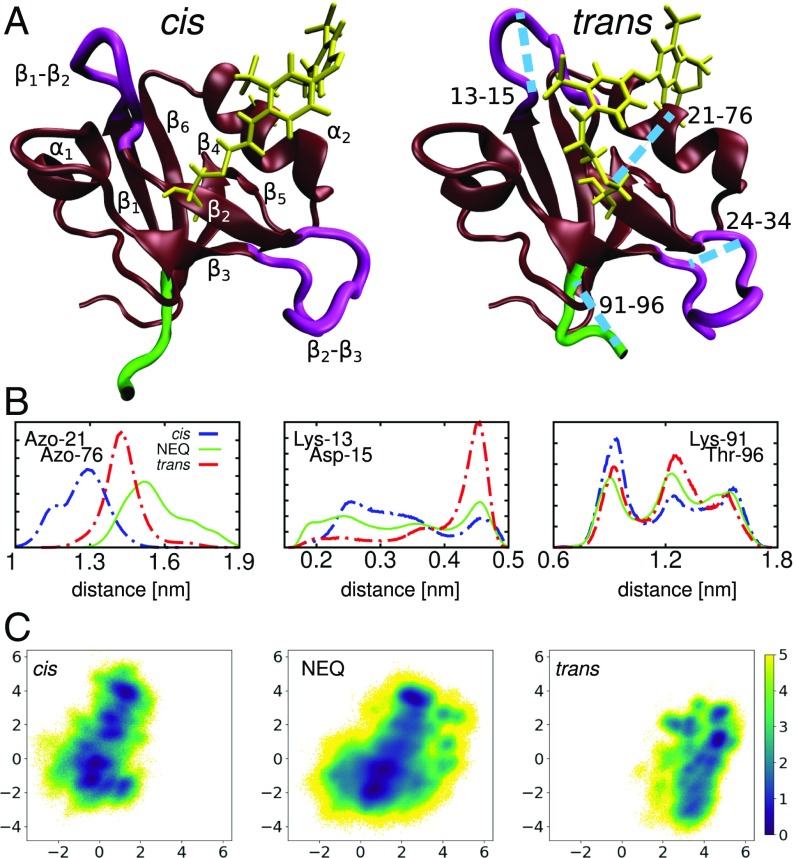
(A) Molecular dynamics snapshots of PDZ2S in cis (Left) and trans (Right) equilibrium states, showing -helices and -sheets in brown, loop regions in purple, the C terminal in green, and the azobenzene photoswitch including linker atoms in yellow. Labels in Left indicate the regions (residues 6 to 12), (20 to 23), (35 to 40), (45 to 49), (57 to 61), (64 to 65), (73 to 80), and (84 to 90). Important loops connecting these regions include (13 to 19), (24 to 34), (41 to 44), and (81 to 83). The blue lines in Right indicate selected long-range distances that characterize the conformational transition following cis–trans photoisomerization of PDZ2S. (B) Distributions of three intramolecular distances that differ significantly in cis (blue) and trans (red) as well as in the NEQ simulations (green); see Materials and Methods. From left to right: Cα-distance between the anchor residues Cys-21 and Cys-76 of the photoswitch, contact distance between Lys-13 and Asp-15 in the -loop, and end-to-end distance of the C-terminal loop. (C) Free energy landscape (in units of ) associated with the cis and trans equilibrium states as well as the NEQ evolution of PDZ2S, expressed by (Materials and Methods). Here is Boltzmann’s constant, T is the temperature, and denote the first two principal components of a dihedral angle PCA (Materials and Methods).

