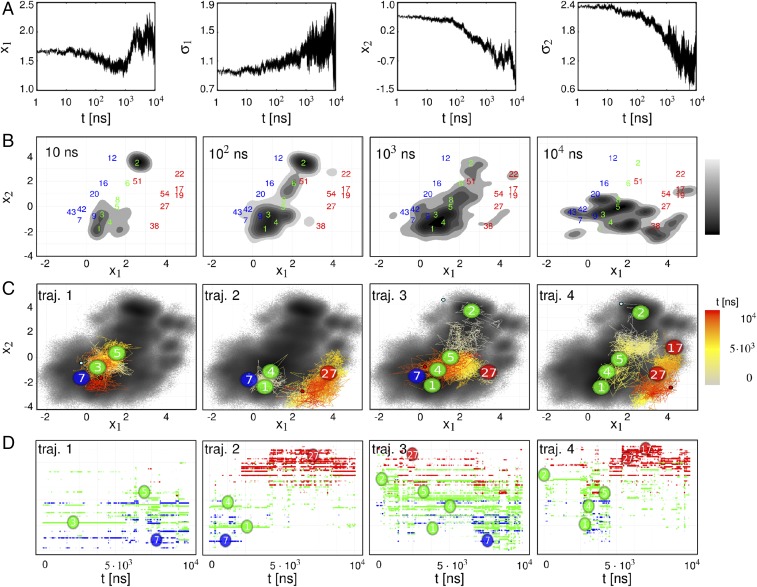
Fig. 3.
(A) From left to right: NEQ time evolution of mean and of the first principal component, and the same for the second principal component. (B) Snapshots of the time evolution of the NEQ density . Numbers in blue, green, and red indicate the location of metastable conformational states of the cis, NEQ, and trans ensembles. States are labeled by decreasing population. (C) Time evolution of selected single NEQ trajectories as indicated by the color code, showing key metastable states visited. The background indicates the NEQ free energy landscape shown in Fig. 1C. (D) Corresponding time evolution in state space (using a linear time axis), with states ordered along the axis by their value of the first principal component.

