Fig. 1.
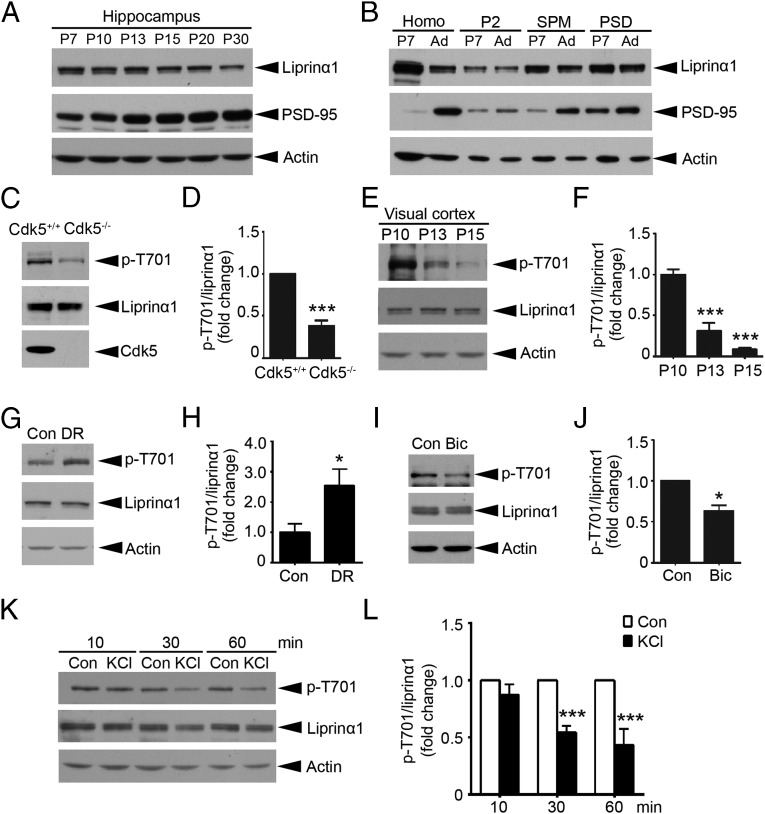
The Cdk5-dependent phosphorylation of liprinα1 is regulated by neuronal activity. (A) Developmental profile of liprinα1 in the mouse hippocampus at the indicated stages. The tissue homogenate (P7–P30) were subjected to Western blot analysis for liprinα1, PSD-95, and actin as a loading control (Con). (B) Liprinα1 was enriched in the PSD fractions of rat brains at both P7 and the adult stage (Ad). The quality of the SPM and PSD fractions was verified by Western blotting against PSD-95. (C and D) Liprinα1 phosphorylation (p-T701) was significantly reduced in E18 Cdk5−/− brains compared with Cdk5+/+ brains. (C) Representative Western blot. (D) Quantification analysis of liprinα1 phosphorylation. ***P < 0.001, Student’s t test; n = 5 mice per genotype. (E–H) Liprinα1 phosphorylation in the mouse visual cortex was reduced from P10–P15 but was increased by dark rearing (DR). (E) Western blot analysis showing a dramatic reduction of liprinα1 phosphorylation in the mouse visual cortex from P10 to P15. (F) Quantification analysis of liprinα1 phosphorylation. ***P < 0.001, one-way ANOVA with the Student–Newman–Keuls test; n = 3 mice per condition. (G and H) DR increased liprinα1 phosphorylation in the mouse visual cortex. (G) Western blot analysis. (H) Quantification of liprinα1 phosphorylation. *P < 0.05, Student’s t test; n = 10 and 11 mice for normal and DR conditions, respectively. (I and J) Bicuculline (Bic) treatment (40 µM, 24 h) reduced liprinα1 phosphorylation in cultured hippocampal neurons. (I) Representative Western blot. (J) Quantification analysis of liprinα1 phosphorylation. *P < 0.05, Student’s t test; n = 3 independent experiments. (K and L) KCl treatment (51 mM) reduced liprinα1 phosphorylation in cultured cortical neurons at 17 DIV compared with NaCl (51 mM) as a control (Con). (K) For Western blot analysis, neurons were treated with NaCl or KCl for 10, 30, or 60 min. (L) Quantification of liprinα1 phosphorylation after KCl treatment or the corresponding NaCl treatment. ***P < 0.001, Student’s t test; n = 3 independent experiments. All data are mean ± SEM.

