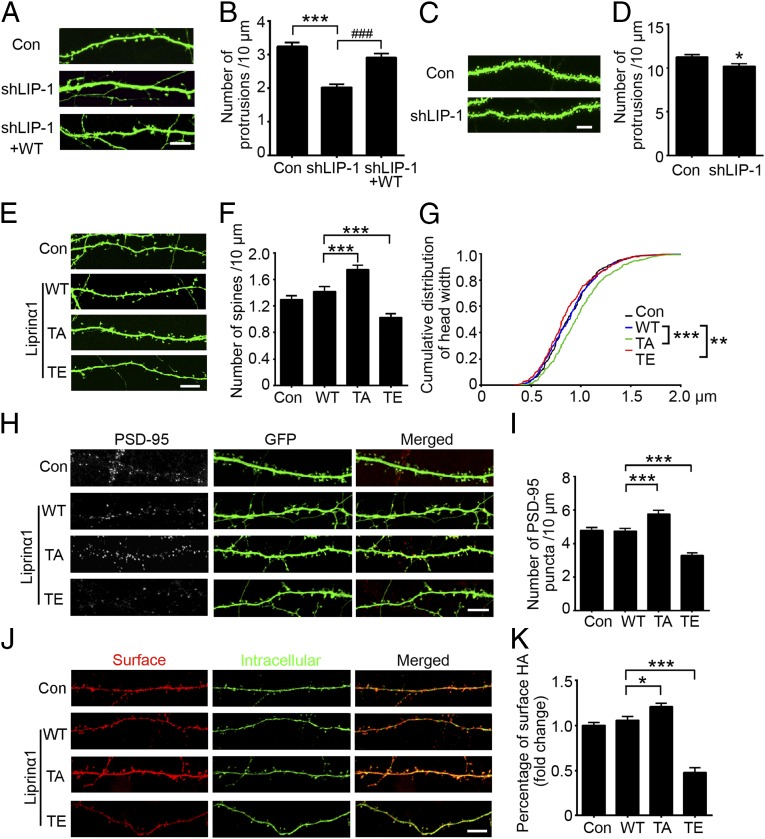
Fig. 2.
Liprinα1 phosphorylation regulates dendritic spine morphology, PSD-95 localization, and GluA2 surface level. (A and B) Liprinα1 knockdown significantly reduced the protrusion density of cultured hippocampal neurons, which was partially rescued by RNAi-resistant human liprinα1 (WT). (A) Representative images of dendrites from neurons transfected with the indicated plasmids. (Scale bar: 10 μm.) (B) Quantification of the dendritic protrusion density of transfected neurons. ***P < 0.001 vs. control (Con); ###P < 0.001 vs. shLIP-1, one-way ANOVA with the Student–Newman–Keuls test. n = 14, 12, and 12 neurons for Con, shLIP-1, and shLIP-1+WT, respectively. (C and D) Liprinα1 knockdown in the mouse hippocampal CA1 region reduced the dendritic protrusion density. (C) Representative images of dendrites from virus-infected neurons. (Scale bar: 5 μm.) (D) Quantification of the dendritic protrusion density. *P < 0.05, Student’s t test; n = 24 and 23 dendrites from three mice each for Con and shLIP-1, respectively. (E–G) Blockade of liprinα1 phosphorylation by the TA mutant promoted spine maturation, whereas the TE mutant induced the opposite effect. (E) Representative dendrite images of neurons transfected with Con, WT, TA, or TE liprinα1. (Scale bar: 10 μm.) (F) Quantification of the mature spine density. ***P < 0.001 vs. WT, one-way ANOVA with the Student–Newman–Keuls test; n = 21, 24, 20, and 24 neurons for Con, WT, TA, and TE, respectively. (G) Cumulative distribution curve of spine head width in the Con, WT, TA, and TE overexpression conditions. **P < 0.01; ***P < 0.001 vs. WT, Kolmogorov–Smirnov test. (H and I) Overexpression of liprinα1 TA mutant increased PSD-95 puncta density, whereas overexpression of TE mutant decreased PSD-95 puncta density. (H) Representative images of PSD-95 puncta distributed along dendrites of neurons transfected with Con, WT, TA, or TE liprinα1. (Scale bar: 10 μm.) (I) Quantification of PSD-95 puncta density. ***P < 0.001 vs. WT, one-way ANOVA with the Student–Newman–Keuls test; n = 10, 11, 9, and 11 neurons for the Con, WT, TA, and TE conditions, respectively. (J and K) Overexpression of TA liprinα1 mutant increased surface GluA2, whereas overexpression of liprinα1 TE mutant decreased surface GluA2. (J) Representative images of surface and intracellular HA staining of transfected neurons. (Scale bar: 10 μm.) (K) Quantification analysis of surface GluA2 as indicated by the ratio of HA surface intensity to the total (i.e., surface plus intracellular). *P < 0.05; ***P < 0.001 vs. WT, one-way ANOVA with the Student–Newman–Keuls test; n = 22, 21, 20, and 23 neurons for the Con, WT, TA, and TE conditions, respectively. All data are mean ± SEM.

