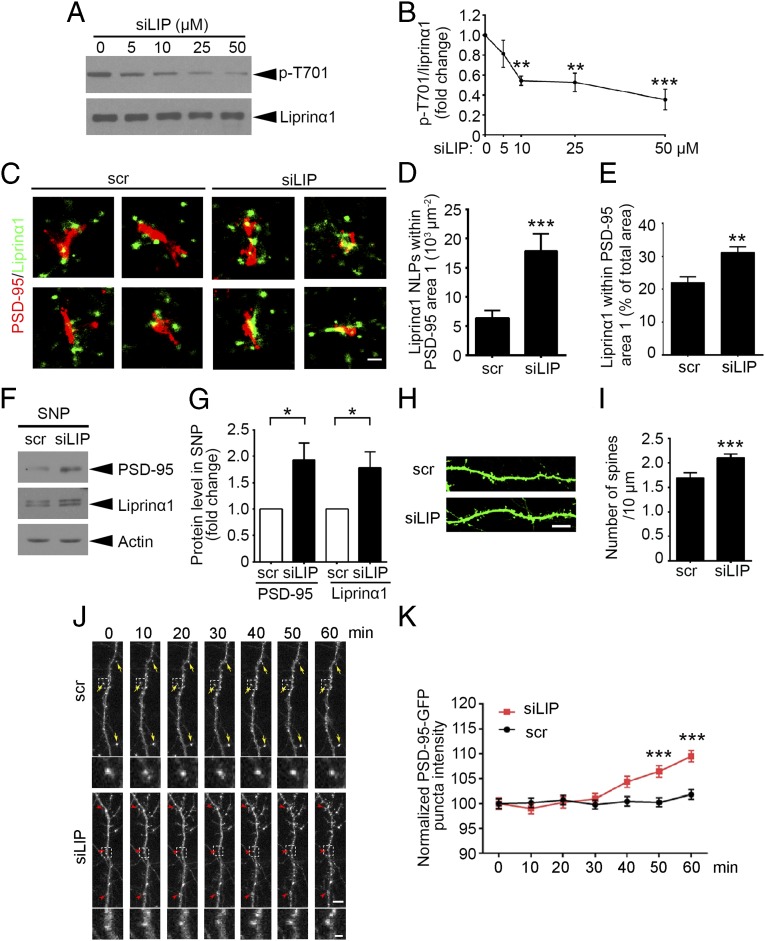
Fig. 4.
The small phospho-interfering peptide of liprinα1 enhances liprinα1–PSD-95 binding and promotes PSD-95 synaptic localization. (A and B) The small phospho-interfering peptide of liprinα1 (siLIP) inhibited liprinα1 phosphorylation in a dosage-dependent manner. (A) Representative Western blot. Cultured neurons were incubated with siLIP at the indicated dosages for 2 h. (B) Quantification of liprinα1 phosphorylation. **P < 0.01; ***P < 0.001, one-way ANOVA with the Student–Newman–Keuls test; n = 4 independent experiments. (C–E) siLIP treatment (10 µM, 30 min) increased liprinα1 localization density and percentage within the PSD-95 region. (C) Individual synapses show the distribution of liprinα1 (green) surrounding PSD-95 (red) in the scramble peptide (scr) and siLIP groups. (Scale bar: 200 nm.) (D and E) Quantification of the localization points (NLPs) of liprinα1 per square micrometer of area 1, and the percentage of liprinα1 within area 1 vs. the total area (area 1 plus area 2). ***P < 0.001; **P < 0.01, Student’s t test; n = 24 and 20 synapses for scr and siLIP, respectively. (F and G) siLIP treatment (10 μM, 30 min) enriched liprinα1 and PSD-95 in the synaptosome. (F) Representative Western blot. (G) Quantification of the protein level changes in liprinα1 and PSD-95 in the synaptosome. *P < 0.05, Student’s t test; n = 4 independent experiments. (H and I) siLIP treatment increased dendritic spine density in cultured hippocampal neurons. (H) Representative images of dendrites from neurons treated with scrambled peptide (scr) or siLIP (10 μM, 30 min). (Scale bar: 10 μm.) (I) Quantification analysis of the mature spine density. ***P < 0.001, Student’s t test; n = 14, 16 neurons for the scr and siLIP conditions, respectively. (J and K) Confocal time-lapse imaging of hippocampal neurons showed that siLIP treatment (10 μM) induced PSD-95 synaptic enrichment. Neurons were transfected with PSD-95–GFP at 14 DIV and imaged at 18–20 DIV. (J) Representative images of dendrites showing enriched synaptic localization of PSD-95 after siLIP treatment (Upper), and higher-magnification images showing the PSD-95 clusters (Lower). Yellow arrow: PSD-95 puncta with similar average intensity; red arrowhead: PSD-95 puncta with increased average intensity. (Scale bar: Upper, 5 μm; Lower, 1 μm.) (K) Quantification of the average intensity of PSD-95–GFP puncta. ***P < 0.001, two-way ANOVA with Bonferroni post hoc test; n = 300∼400 puncta for each time point in scr or siLIP treatment. All data are mean ± SEM.

