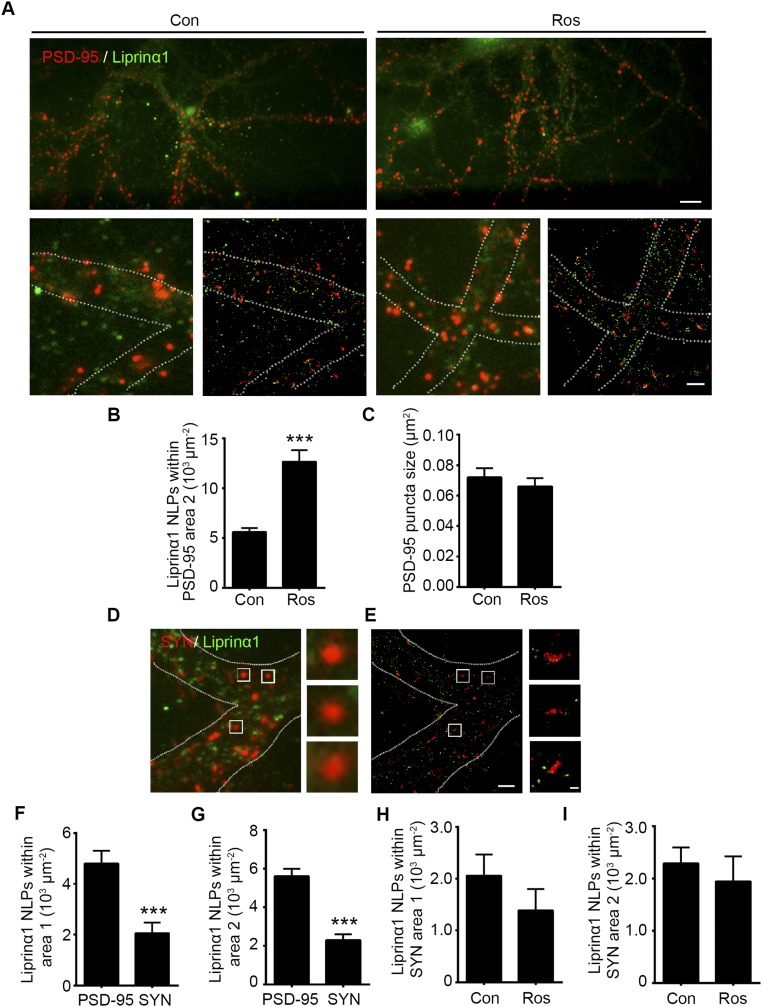
Fig. S3.
Superresolution imaging showing that reduced liprinα1 phosphorylation increases the colocalization of liprinα1 with PSD-95 at postsynaptic regions. (A–C) Roscovitine (Ros) treatment increased liprinα1 localization density in the surrounding region of PSD-95 (area 2) but did not change PSD-95 puncta size. (A) Wide-field images of endogenous liprinα1 (green) and PSD-95 (red) (Upper: magnification, 40×, scale bar: 8 µm; Lower: magnification, 150×) and the corresponding STORM images (scale bar: 2 µm.) Neurons were treated with DMSO as a control (Con) or with Ros for 2 h and then stained with liprinα1 and PSD-95. (B and C) Quantification of the number of localization points (NLPs) of liprinα1 per µm2 of area 2 and the size of PSD-95 puncta, respectively. ***P < 0.001, Student’s t test; n = 53 and 51 synapses for Con and Ros, respectively. Data are mean ± SEM. (D–G) Liprinα1 was more enriched in the PSD-95–positive region than the synaptophysin (SYN)-positive region. (D and E) Low-magnification images and corresponding STORM images of liprinα1 (green) and SYN (red) (Scale bars: Left, 2 µm; Right, 200 nm.) (F and G) Quantification analysis of liprinα1 distribution density in PSD-95–positive and SYN-positive regions in area 1 (F) and area 2 (G). ***P < 0.001, Student’s t test; n = 53 and 52 PSD-95– and SYN-positive regions, respectively. Data are mean ± SEM. (H and I) Quantification analysis showing that Ros treatment did not alter the density of liprinα1 localization in area 1 (H) or area 2 (I) of SYN. Student’s t test; n = 52 and 34 regions for Con and Ros treatment, respectively.

