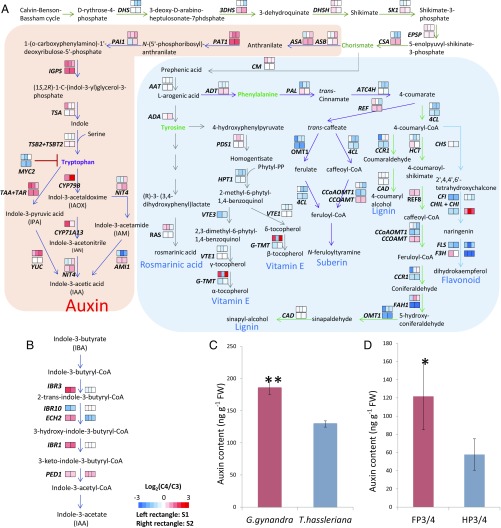
Fig. 1.
Expression ratios of genes involved in auxin biosynthesis and differences in auxin content between C4 G. gynandra and C3 T. hassleriana developing leaves or between maize foliar and husk leaf primordia. (A) The Trp-dependent auxin (shaded in pink) and other secondary metabolite (shaded in light blue) biosynthesis pathways, including key intermediates and enzymes. (B) The Trp-independent auxin biosynthesis pathway. (A and B) The Trp-dependent and -independent auxin biosynthesis pathways were based on the pathways in A. thaliana (33–36). We could not find maize genes that are clearly orthologous to CYP79B and CYP71A13 in A. thaliana. In A and B, each enzymatic reaction is represented by an arrow. In each step, the two colored rectangles indicate the fold differences (log2 ratios) of gene expression between G. gynandra and T. hassleriana at the S1 (left rectangle) and S2 (right rectangle) developmental stages, respectively. The three colored rectangles indicate the fold differences of gene expression between maize foliar (FP) and husk leaf (HP) primordia during the midvein initiated stage (Left), midvein lateral initiated stage (Middle), and the midvein lateral and intermediate initiated stage (Right), respectively. (For definitions of developmental stages of maize foliar and husk leaf primordia, see ref. 20.) Colors represent log2 ratios of gene expression levels according to the color bar at the Bottom of the figure. The G. gynandra and T. hassleriana gene RPKM values are from Dataset S3, and the maize data are from Wang et al. (20). (C) The auxin contents in developing leaves of G. gynandra and T. hassleriana. The fifth young developing leaves (∼3 mm long) were selected to analyze auxin content (Dataset S4). (D) The auxin contents in maize foliar and husk leaf primordia. The maize foliar (FP3/4) and husk (HP3/4) leaf primordia (∼2 mm long) were selected to analyze auxin contents. (C and D) Error bar indicates the SD of the mean auxin contents (nanograms per gram fresh weight) in three biological replicates (Dataset S4). FW, fresh weight. *P < 0.05 and **P < 0.001 (Student’s one-tailed t test).

