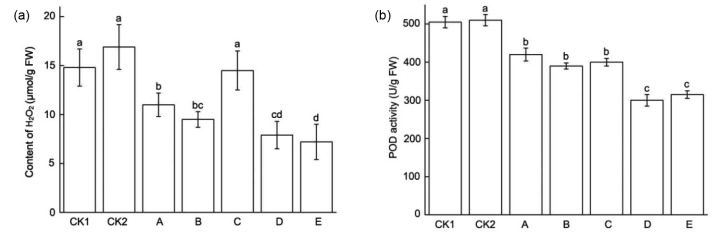
Fig. 5.
Effects of different SAPs on H2O2 content and POD activity in germinating seeds
H2O2 content (a) and POD activity (b) in seeds with different coatings after five days of imbibition. CK1 and CK2 represent naked seeds and seeds coated with clay and talcum powder, respectively. Groups A, B, C, D, and E represent seeds coated with corresponding SAP. The data are expressed as mean±SD from three replicates. Different superscript letters indicate significant difference at the P<0.05 level

