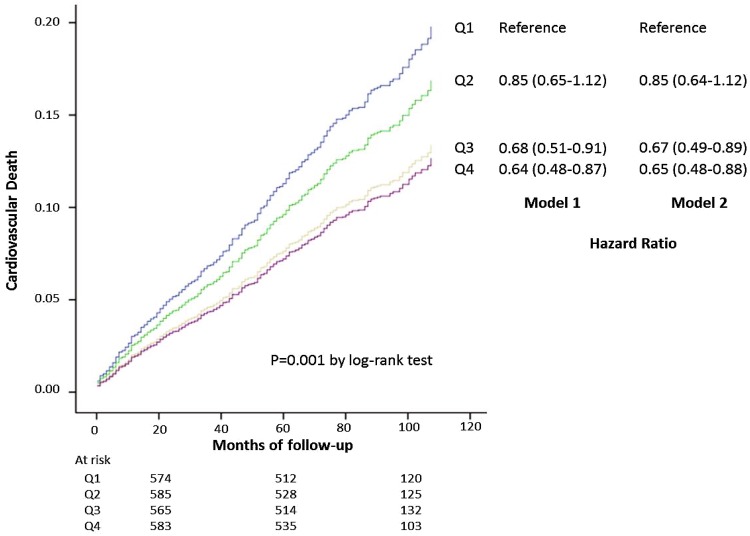
Fig. 4.
Cellular cholesterol efflux and cardiovascular mortality. Kaplan–Meier curves and hazard ratios by quartiles of cholesterol efflux capacity. Model 1: adjusted for age and gender; Model 2: also adjusted for use of lipid-lowering drugs, CHD (none, stable, unstable CHD, NSTEMI, STEMI), body mass index, hypertension, smoking, LDL-C/HDL-C ratio, triglycerides, metabolic syndrome/type 2 diabetes mellitus [26]. With permission of Springer [7]

