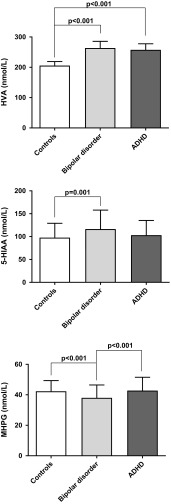
Fig. 1.
Column graph showing the CSF concentrations (nmol/L) of HVA, 5-HIAA, and MHPG in patients and controls (mean and 95% confidence interval). One-way ANOVAs were used to analyze group differences and log-transformed data were used for HVA and 5-HIAA. Bonferroni post hoc tests were conducted following significant ANOVAs to assess between-group differences (p values shown in graph)

