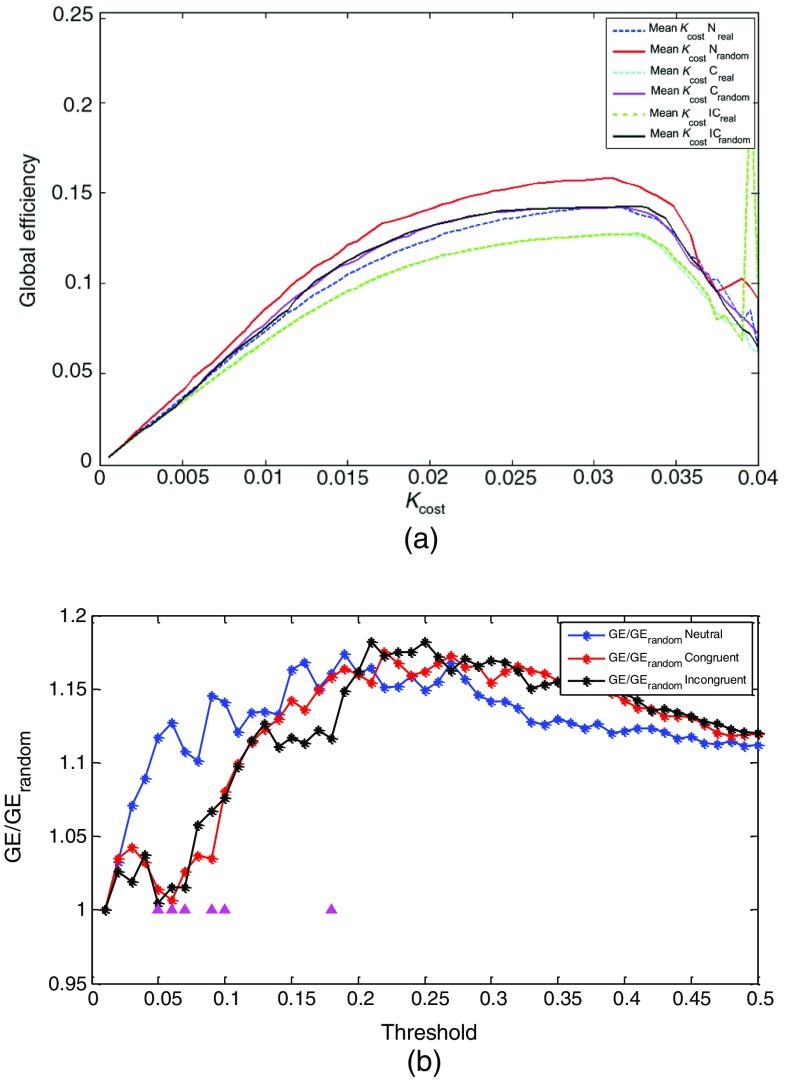
Fig. 4.
(a) The dependence among global efficiency values for three types of stimuli [neutral (N), congruent (C), and incongruent (IC)] and percentage of strongest connections in the network (). The solid lines correspond to real network, and the dashed lines correspond to random networks. (b) The ratios of global efficiency () between the real brain functional networks and 100 degree matched random networks to assess small-worldliness of brain functional networks. The purple triangles indicate that there are significant differences among the GE of three types of stimuli ().

