
Figure 2.
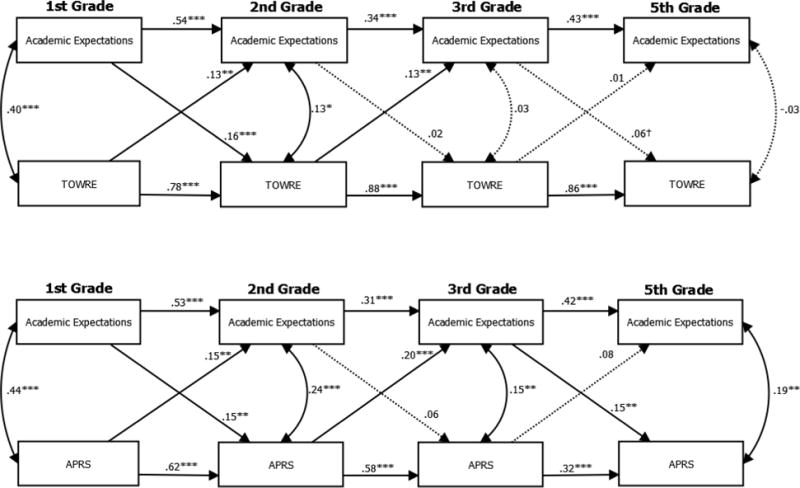
Cross-lagged Path Models of Parent Academic Expectations and Child Academic Performance. Note: The TOWRE involved the direct assessment of child reading fluency; the APRS involved teacher ratings of child academic performance; dotted lines indicate non-significant paths; control variables include family SES and single-parent status as well as child age, race, and sex; † p < .10; * p < .05; ** p < .01; *** p < .001.