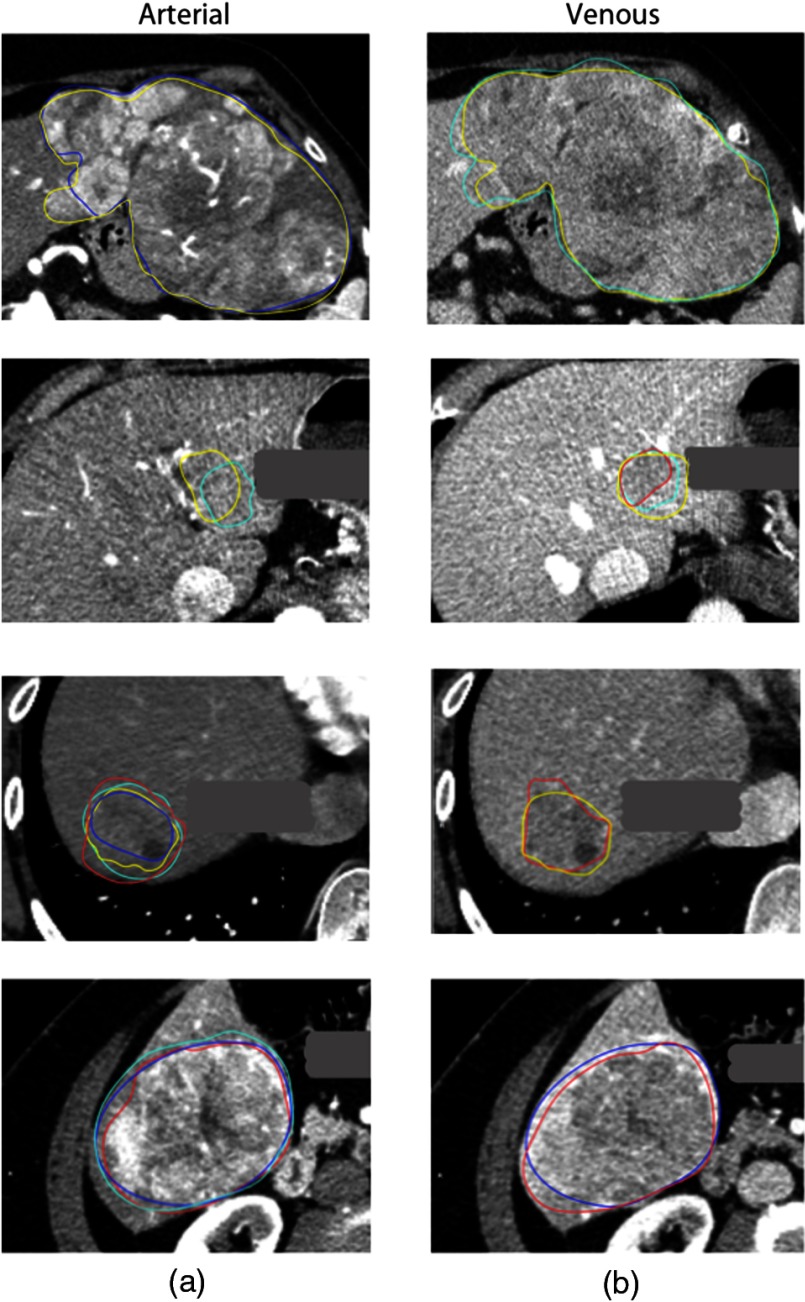
Fig. 2.
Example outlines for four different patients by four different readers (yellow, reader 1; teal, reader 2; red, reader 3; blue, reader 4) with different overlaps for arterial and venous images. The dice similarity coefficient, measuring agreement between readers, where they assessed the same slice ranged from 0.19 to 0.93

