
Figure 3. Longitudinal cortical thinning and subcortical atrophy in MS.
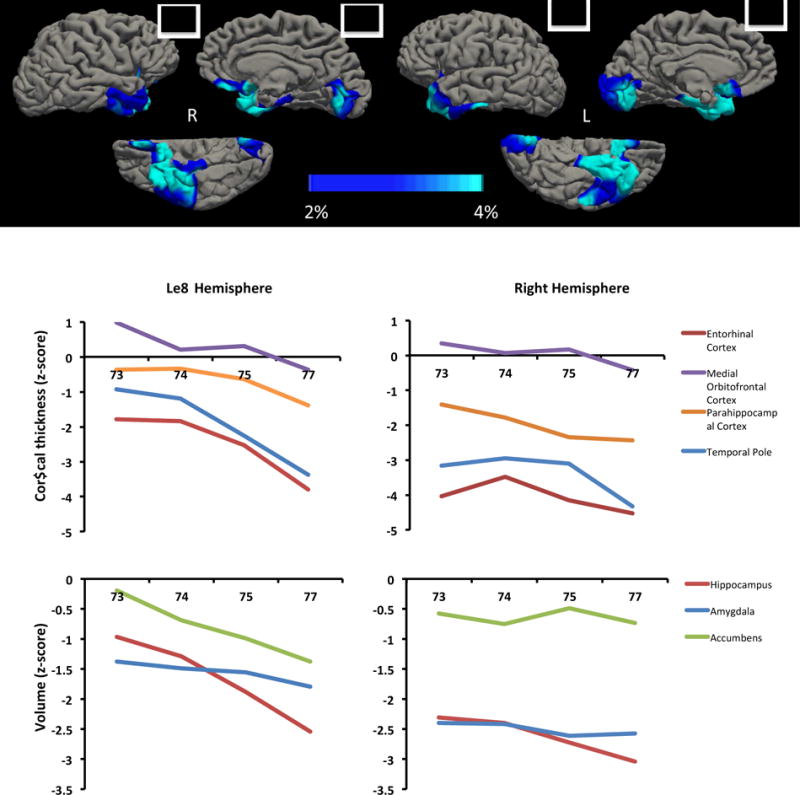
From age 73 to 77 MS displayed progressive cortical atrophy in the bilateral anterior temporal lobes, medial orbitofrontal cortex, and lingual gyri. Time points included in the longitudinal analysis were age 73, age 74, age 75 and age 77. Color bar represents the rate of cortical thinning per year as a percentage of baseline (age 73) cortical thickness.