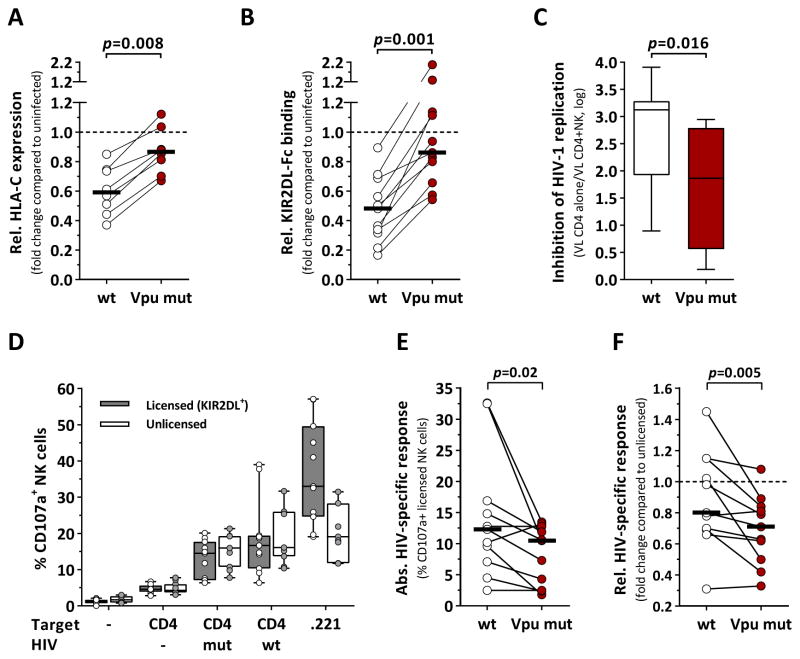
Figure 4. NK cells are able to sense HIV-mediated changes in HLA-C expression.
(A) Comparison between JR-CSF wildtype (wt) and the Vpu mutant strain (Vpu mut) in terms of their ability to downmodulate HLA-C. Vpu mut contained the Vpu protein sequence of NL4-3 in position 4 and 5 (L4I+Q5del). Relative HLA-C expression of CD4+ T cells infected with either wt (clear) or Vpu mut (red) as compared to uninfected cells, given as fold change (n=8). HLA-C expression was quantified as median fluorescence intensity. (B) KIR2DL binding (KIR2DL1, KIR2DL3) to CD4+ T cells infected with either wt (clear) or Vpu mut (red) as compared to uninfected cells, given as fold change (n=11; KIR2DL1: n=6; KIR2DL3: n=5). KIR binding was quantified as relative fluorescence intensity. (C) Levels of NK-cell-mediated inhibition of HIV-1 replication after 7d co-culture with CD4+ T cells infected with either wt or Vpu mut (n=8). Inhibition of HIV-1 replication was calculated from viral loads (copies/ml) in the presence or absence of NK cells. (D) Frequency of CD107a+ NK cells after 6h co-incubation with various target cells. NK cells single positive (sp) for KIR2DL1, KIR2DL3, KIR3DL1 and NKG2A were identified by Boolean gating. Licensed KIR2DL+ NK cells were defined as KIR2DL1sp NK cells from C2+ donors (n=3) or KIR2DL3sp NK cells from C1+ donors (n=8) (grey box plots). Unlicensed NK cells lacked all mentioned inhibitory receptors (white box plots). (E) HIV-specific responses of licensed KIR2DL+ NK cells (n=11) after exposure to CD4+ T cells infected with either wildtype (clear) or Vpu mut (red). Absolute HIV-specific responses are given as % CD107a+ NK cells after adjustment for non-HIV-1-specific responses (NK cells alone & mock-infected CD4+ T cells). (F) Comparison of the relative HIV-specific responses of licensed KIR2DL+ NK cells after exposure to CD4+ T cells infected with either wildtype (clear) or Vpu mut (red). Relative HIV-1-specific responses are given as fold change compared to HIV-specific responses of unlicensed NK cells. Black bars represent the median. Box plots represent median and IQR. Statistical analyses: Wilcoxon matched-pairs signed rank test. See also Figure S3.

