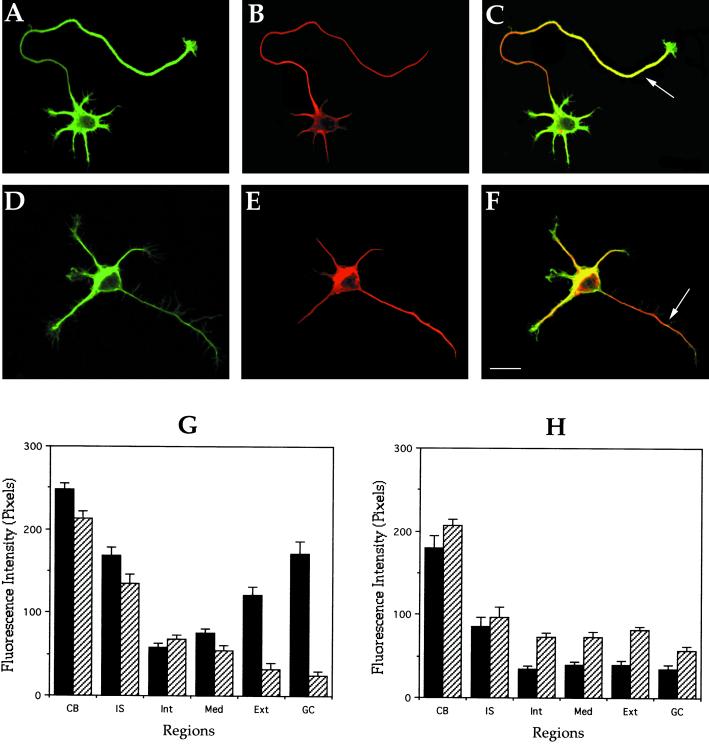
Figure 5.
Distribution of stable and dynamic microtubules in control and MAP1B-deficient neurons. (A and B) Confocal fluorescence images showing the distribution of tyrosinated (green) and detyrosinated (red) α-tubulin in a cultured hippocampal pyramidal neuron from a wild-type animal. (C) Red-green overlay of the images shown previously. Note that within the axon tyr-tubulin staining predominates at the distal segment (arrow) and growth cone. (D and E) Confocal fluorescence images showing the distribution of tyrosinated (green) and detyrosinated (red) α-tubulin in a cultured hippocampal pyramidal neuron from a MAP1B-deficient mice. (F) Red-green overlay of the images shown previously. Note that although the tyr-immunolabeling decreases along the axon, the one corresponding to detyr-tubulin increases (arrow). For this experiment, cells were fixed with detergents under microtubule-stabilizing conditions before fixation. Bar, 10 μm. (G and H) Quantitative fluorescence measurements of tyrosinated (▪) and detyrosinated (▨) α-tubulin immunolabeling in cytoskeletal preparations from cultured hippocampal pyramidal neurons of wild-type (G) and MAP1B-deficient mice (H). Measurements were performed in equivalent regions to those described in Figure 4. A total of 75 cells was analyzed for each experimental condition.

