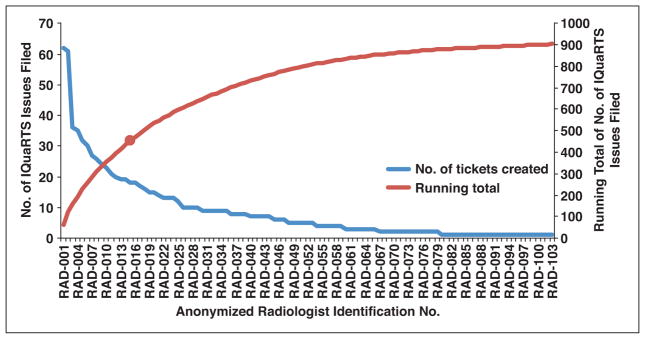
Fig. 4.
Graph shows number of issues filed by individual radiologists (blue line) and running total (red line) during 5-month period using Image Quality Reporting and Tracking Solution (IQuaRTS). Radiologist names have been sorted in descending order of issues submission count and then anonymized. Red circle represents 50% point of total 903 issues filed. Fifteen of participating 103 radiologists submitted 50% of all issues.

