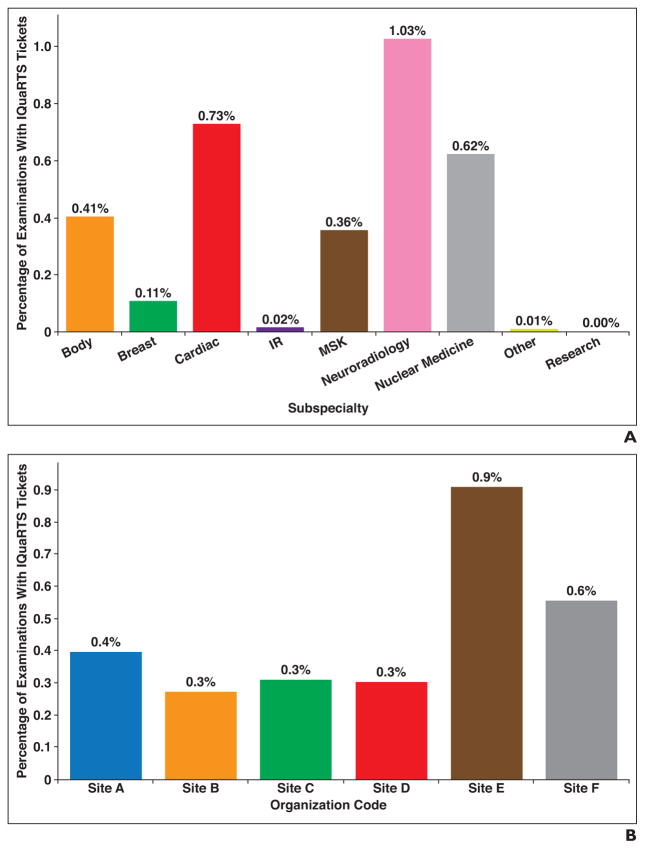
Fig. 6.
Number of issues filed by radiologists in 5-month period using Image Quality Reporting and Tracking Solution (IQuaRTS).
A, Bar graph shows number of issues filed in 5-month period using IQuaRTS categorized by radiologist subspecialty. Percentages were calculated as follows: (number of examinations with issues filed in subspecialty) ÷ (number of examinations performed in subspecialty). IR = interventional radiology, MSK = musculoskeletal.
B, Bar graph shows number of issues filed in 5-month period using IQuaRTS categorized by site of examination acquisition. Percentages were calculated as follows: (number of examinations with issues filed performed at site) ÷ (number of examinations performed at site).

