
Figure 7.
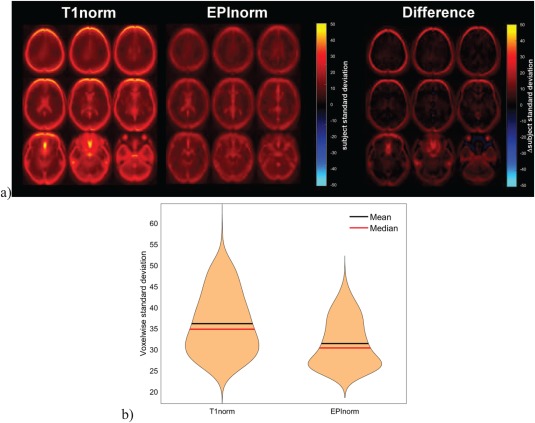
T1norm versus EPInorm in ABIDE dataset: (a, left) T1 norm voxelwise subject standard deviation, (a, middle) EPInorm voxelwise subject standard deviation, (a, right) difference (T1norm–EPInorm). (b) Violin plot of the voxels showing a subject standard deviation of over 25, T1norm is clearly much higher. [Color figure can be viewed at http://wileyonlinelibrary.com]