
Figure 9.
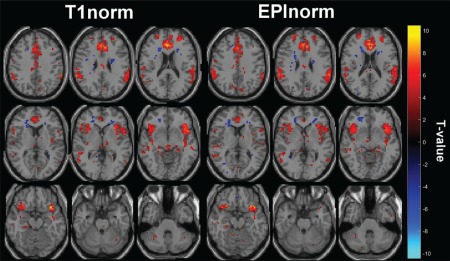
T values corresponding to false alarms versus hits for the go/no‐go task with distortion correction for (a) T1norm and (b) EPInorm. [Color figure can be viewed at http://wileyonlinelibrary.com]
Official websites use .gov
A
.gov website belongs to an official
government organization in the United States.
Secure .gov websites use HTTPS
A lock (
) or https:// means you've safely
connected to the .gov website. Share sensitive
information only on official, secure websites.
T values corresponding to false alarms versus hits for the go/no‐go task with distortion correction for (a) T1norm and (b) EPInorm. [Color figure can be viewed at http://wileyonlinelibrary.com]