
Figure 10.
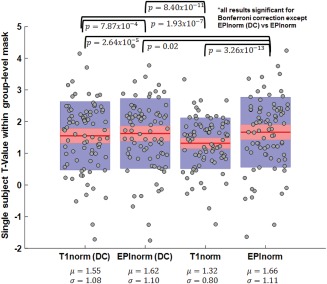
Single‐subject T values for the four cases (T1norm, EPInorm, T1norm with distortion correction, and EPInorm with distortion correction): EPInorm shows the highest mean T‐values and T1norm without distortion correction is significantly lower than the other three approaches. [Color figure can be viewed at http://wileyonlinelibrary.com]