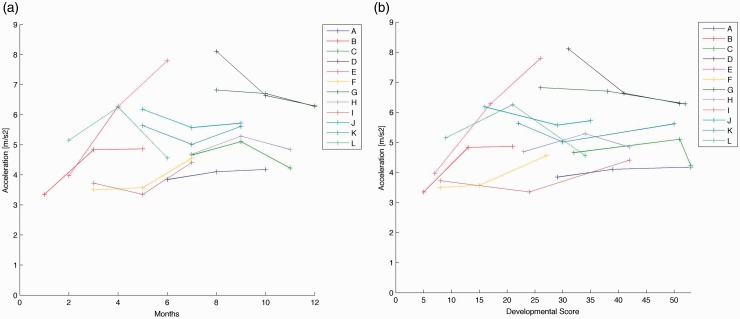
Figure 3.
(a) Peak acceleration of movement of right leg, each line represents an infant across three visits. Peak acceleration of movement by chronological age. (b) Peak acceleration of movement of right leg, each line represents an infant across three visits. Peak acceleration of movement by Alberta Infant Motor Scale developmental score.

