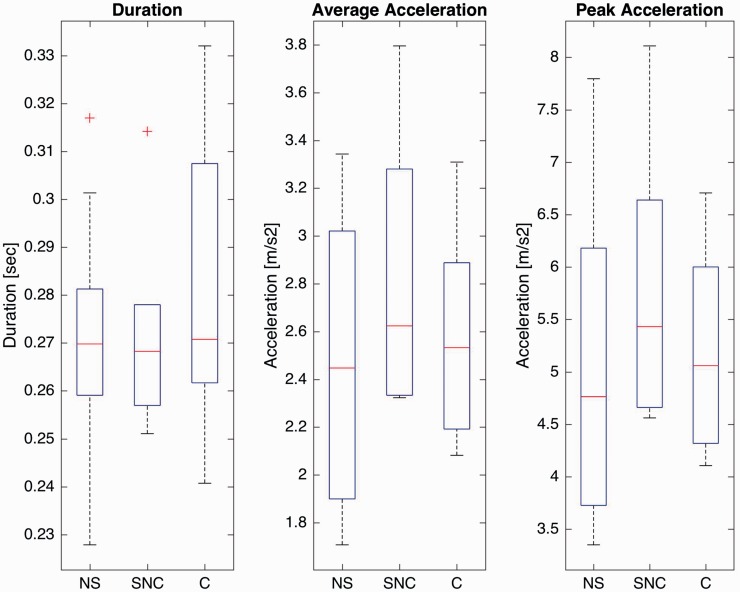
Figure 5.
Mean and range of variation of kinematics across all visits by group: not yet able to sit (NS; n = 18 visits), able to sit but not crawl (SNC, n = 6 visits), and able to crawl (C, n = 12 visits). The box indicates the first and third quartile range, the red line indicates the median value, whiskers indicate 1.5 times the interquartile range, and the + indicate values outside that range.

