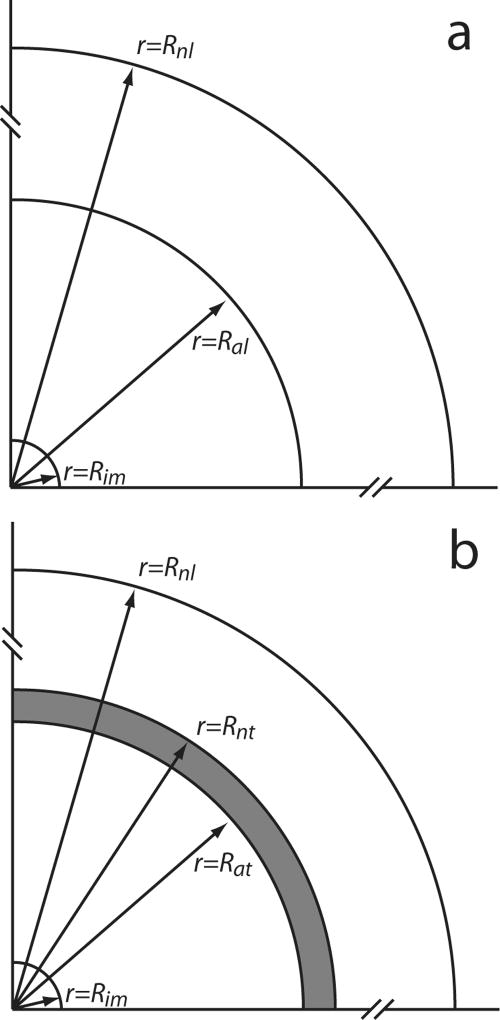
Figure 1.
Schematic representation of regions around the polymer implant assumed in simulating drug distribution in tissue: (a) normal liver with an ablated core; and (b) liver with a partially ablated tumor. The radii of the implant (im), ablated liver tissue (al), non-ablated liver (nl), ablated tumor (at), and non-ablated tumor (nt) are indicated by the arrows. The dark region at the periphery of ablated tumor is considered to have greater risk of tumor recurrence because of lower heat exposure. Distances not to scale.

