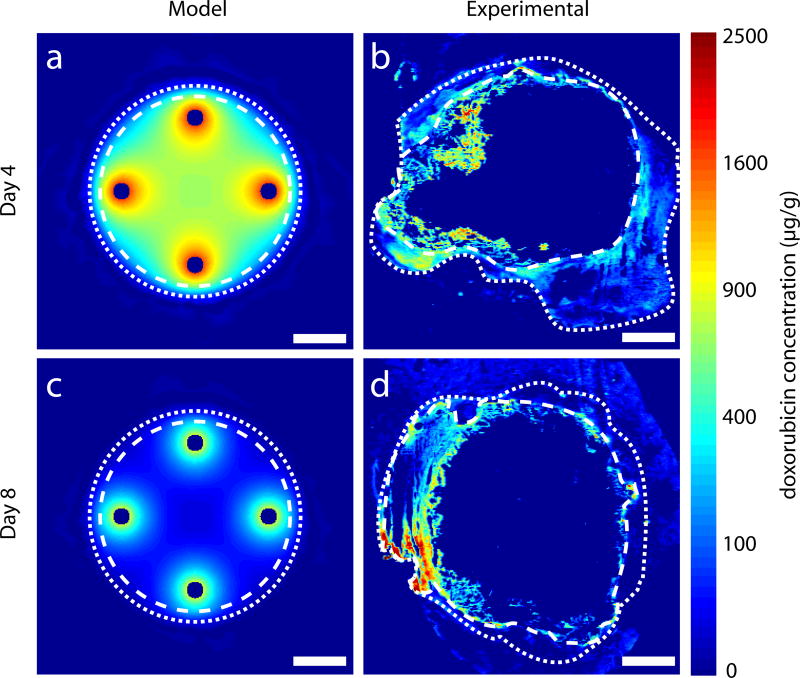
Figure 6.
Simulated drug distribution in ablated tumor tissue compared to DOX distribution in images of ablated tumor liver from in vivo rabbit experiments with four peripheral implants. The outer extent of the ablated regions is within white dashed lines and the outer extent of the non-ablated tumor is within white dotted lines. Model simulated DOX distributions on day 4 (a) and day 8 (c). DOX distributions from experimental images on day 4 (b) and day 8 (d). Central portion of ablated tumor is not visible in experimental images because of extensive necrosis. Scale bars are 5 mm.

