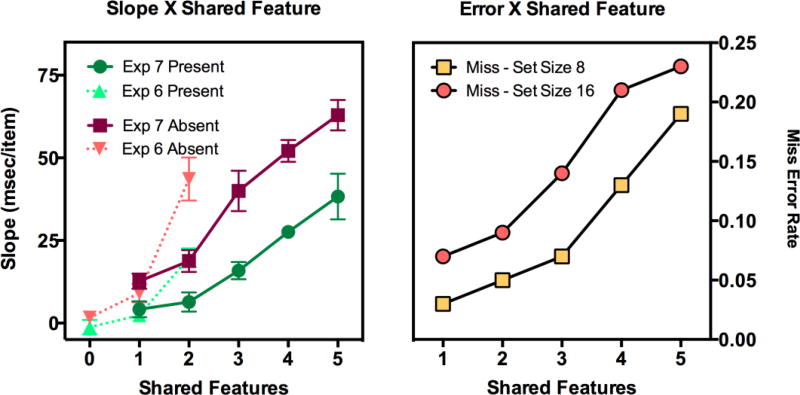
Figure 14.
Slopes (left panel) and miss error rates (right panel) as a function of number of shared features in Experiment 7. Dotted lines in left panel show data from Experiment 6 for comparison. Error bars are +/− 1 within-observer s.e.m. using the method of Cousineau (2005), corrected by Morey (2008, see also Cousineau & O’Brian, 2014).

