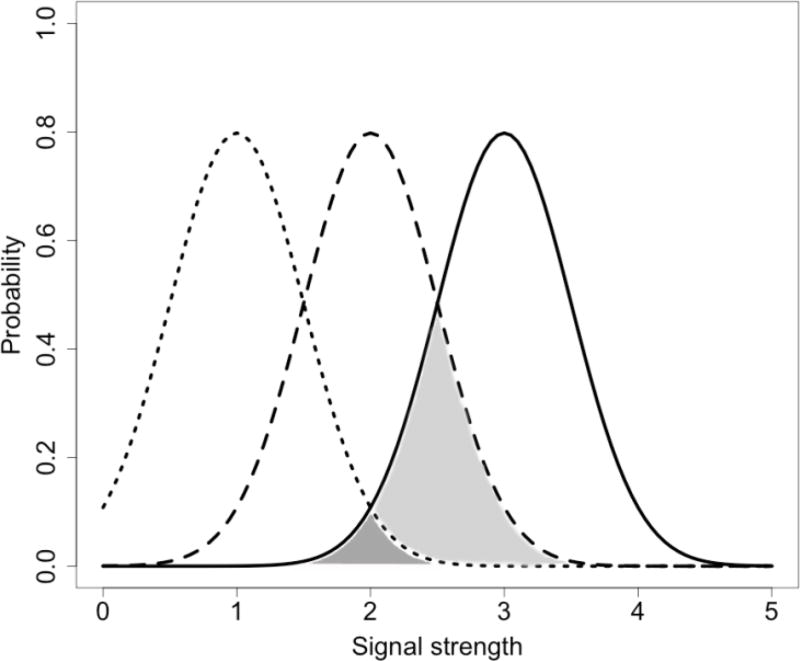
Figure 15.
Three hypothetical distributions of signal strength for elements with varying average signal strength. As can be seen, the overlap between the distribution with the highest average (the solid line) and the other distributions quickly drops. In this example, although the distances between the distribution averages are linear, the overlaps between distributions are not. The probability that a signal drawn from the low average distribution (dotted line) is higher than a signal drawn from the high average distribution (full line) is less than half the probability that a signal drawn from the medium average distribution (striped line) is higher than a signal from the high average distribution (compare dark grey and light grey area respectively).

