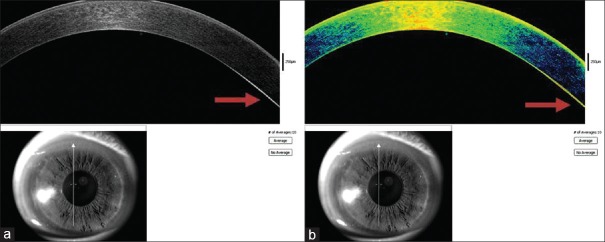
Figure 2.
(a) Anterior segment optical coherence tomography gray scale analysis of Kayser–Fleischer ring of patient five showing hyperreflectivity (arrow) at the level of Descemet membrane. (b) Color scale of anterior segment optical coherence tomography of Kayser–Fleischer ring of patient five showing predominantly orange band (arrow) at the level of Descemet membrane

