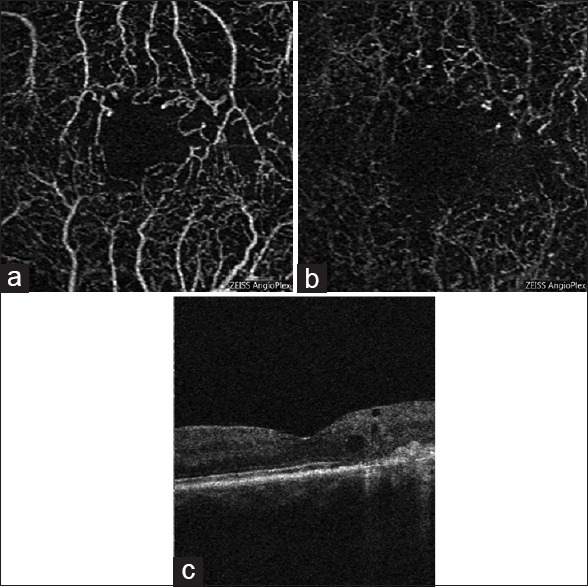
Figure 5.

En face optical coherence tomography angiogram images of the left eye of a patient with diabetic retinopathy and cystoid macular edema. (a) 3 mm × 3 mm enface optical coherence tomography angiogram of superficial capillary plexus. (b) 3 mm × 3 mm en face optical coherence tomography angiogram of deep capillary plexus. (c) Optical coherence tomography B-scan illustrating the cystoid spaces and some disorganization of the retinal inner layers in areas of nonperfusion temporal to the fovea
