
Fig. 2. Optical detection design.
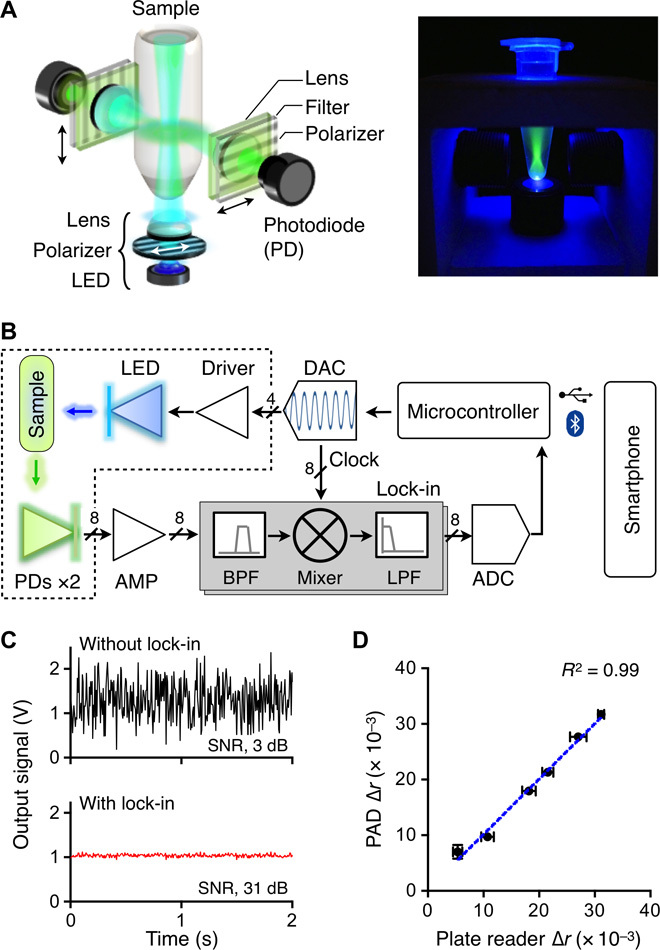
(A) Schematic of an optical cube. The optical excitation module has an LED, a linear polarizer, and a focusing lens. The emission light is measured by a pair of detector sets, each consisting of a lens, a polarization filter, and a photodiode (PD). (B) Circuit diagram. The on-board computer controls the entire system and communicates with a smartphone. To enhance the signal-to-noise ratio (SNR), the system uses the optical lock-in detection scheme. The intensity of the excitation light is amplitude-modulated, and the resulting emission intensities are mixed with the carrier frequency. The dotted box indicates an optical cube. BPF, band-pass filter; LPF, low-pass filter; AMP, amplifier. (C) The lock-in method significantly improved the signal-to-noise ratio (630 times, 28 dB). (D) The accuracy of the PAD was benchmarked against a commercial plate reader. The measured values show excellent agreements (R2 = 99%). Experiments were performed in triplicate, and the data were displayed as means ± SD. Horizontal and vertical error bars were from the plate reader and the PAD measurements, respectively.