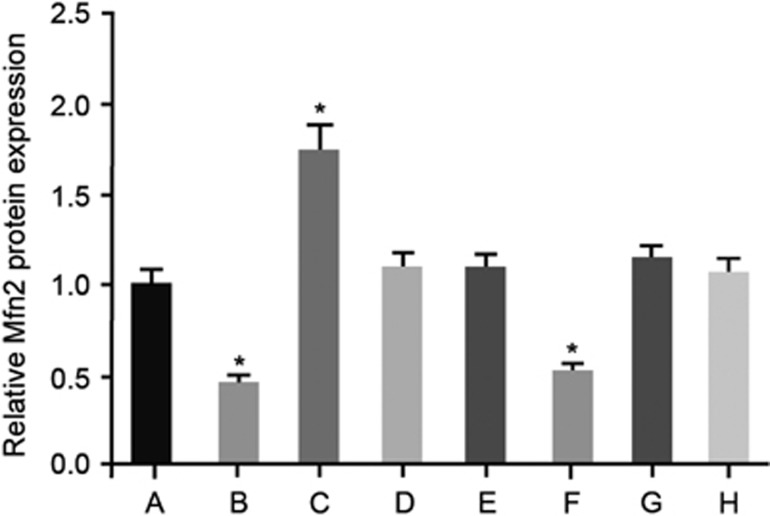
Figure 10.
The expression level of Mfn2 protein in rats detected by immunohistochemical staining in the eight groups. Notes: (a) group, transfected with an empty plasmid; (b) group, transfected with miR-214 mimics; (c) group, transfected with miR-214 inhibitors; (d) group, transfected with mimics NC; (e) group, transfected with inhibitors NC; (f) group, transfected with Mfn2 siRNA; (g) group, transfected with miR-214 mimics and Mfn2 siRNA; (h) group, normal saline; *P<0.05 compared with the blank group. NC, negative control.

