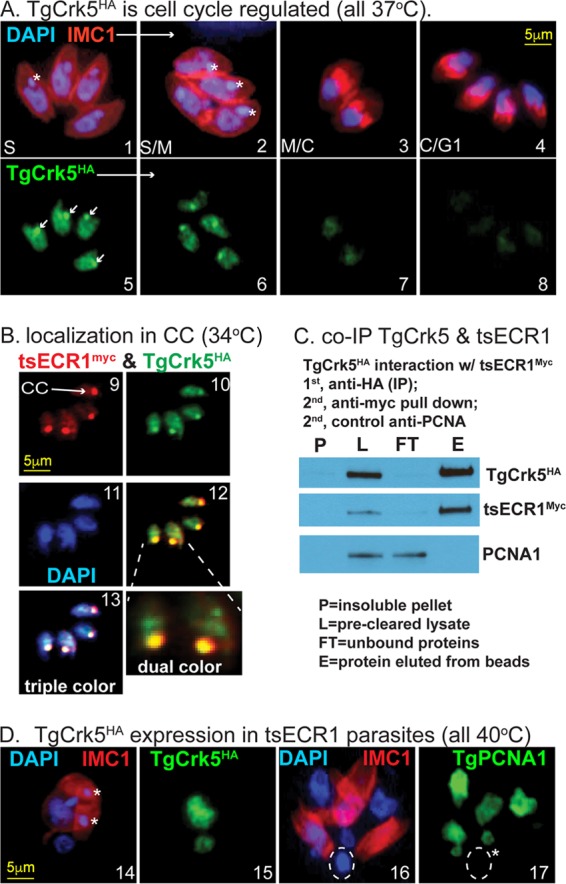
FIG 6 .

TgCrk5 is associated with ECR1 during tachyzoite replication. (A) TgCrk5HA transgenic parasites were costained with anti-HA, anti-IMC1, and DAPI, and representative images of parasites in S through early G1 phase of the next cell cycle are shown. Images 1 to 4 depict the merging of αIMC1 and DAPI staining showing the mother IMC and daughter buds in relation to genomic and plastid DNA. Note the daughter buds formed in image 3 precede nuclear division, whereas nuclei in the four parasites in image 4 are now packaged into the nearly mature daughters representative of late cytokinesis and early G1 cell cycle time periods. The white asterisks indicate plastid DNA. Images 5 to 8 depict costaining of the parasites in images 1 to 4 with anti-HA, revealing the cell cycle expression patterns of TgCrk5HA. The maximum expression in S phase and low to near undetected expression in late cytokinetic/early G1 parasites are consistent with the encoded mRNA cell cycle profile (Fig. 7A). Localization of TgCrk5HA in the centrocone is indicated by white arrows in image 5. (B) TgCrk5 was epitope tagged with 3×HA in tsECR1Myc transgenic parasites. IFA analysis (images 9 to 13) of this new dual-epitope-tagged strain demonstrated colocalization of tsECR1Myc and TgCrk5HA in the parasite centrocone (CC) and nucleus at 34°C. Note that the expression level of TgCrk5HA was higher than that of tsECR1Myc in these parasites. Image 12 depicts merged staining results for TgCrk5HA and tsECR1Myc expression with higher magnification of the two centrocone structures indicated. Image 13 depicts merged staining results for anti-HA, anti-Myc, and DAPI stain used to indicate nuclear DNA. (C) Immunoprecipitation of TgCrk5HA confirms interaction with tsECR1Myc in parasites grown at 34°C. Western analysis reveals that virtually all cellular tsECR1Myc protein was pulled down with TgCrk5HA, while the abundant nuclear factor TgPCNA1 was not pulled down. The results shown are representative of three independent replicates of the coimmunoprecipitation experiment. (D) IFA analysis of the dual-tagged TgCrk5HA/tsECR1Myc strain at 40°C. Similar to panel A, parasites were costained for DNA and IMC1 (images 14 and 16) and then for TgCrk5HA (image 15) or TgPCNA1 (image 17). The white asterisks in images 14 and 17 indicate plastid DNA, which in images 16 and 17 have aggregated into a single deposit (dashed circle) that does not contain TgPCNA1. The scale bars for image series in panels A, B, and C are indicated once in each series.
