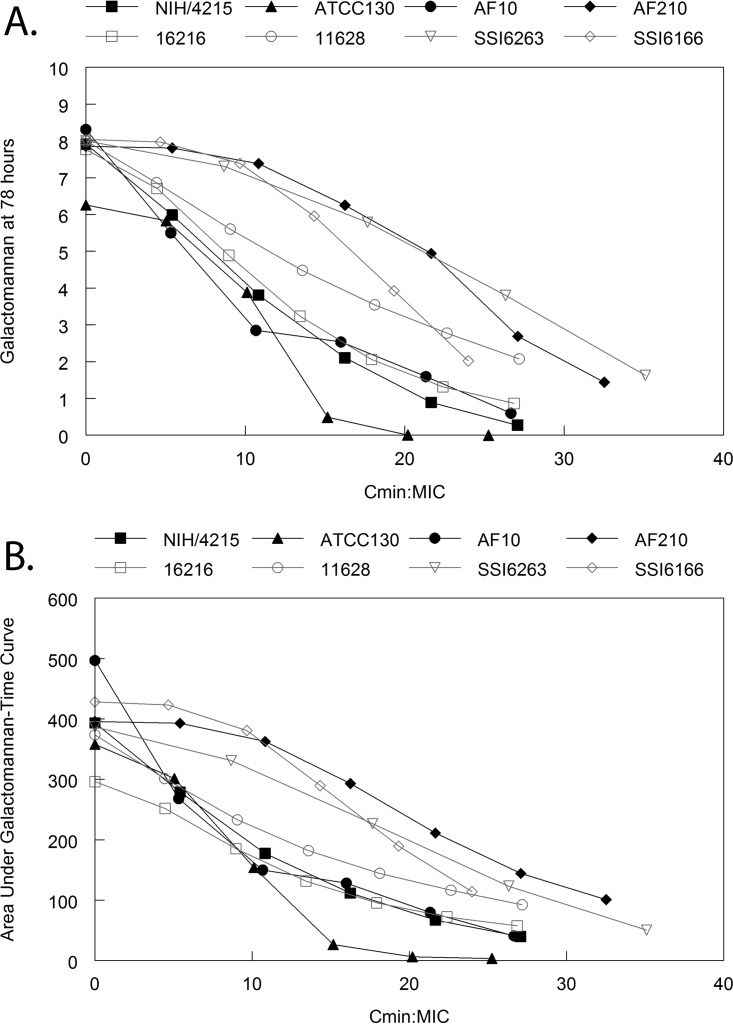
FIG 5 .
Model-predicted (i.e., from the PK-PD mathematical models fitted to the data from each strain, summarized in Table S1) relationship between drug exposure (quantified in terms of the Cmin/MIC) and the measured galactomannan at the end of each experiment (i.e., 78 h) (A) and area under the galactomannan-time curve from time = zero to time = 78 h (B). The black lines are the data for triazole-wild-type strains (defined phenotypically), and the grey lines are the data for triazole-resistant mutants (defined phenotypically and genotypically). As the Cmin/MIC increases, there is a progressively greater antifungal effect, as evidenced by lower GM levels at the end of the experiment. Using a target of 27% reduction in the area under the galactomannan-time curve (which corresponds to the effect induced by a posaconazole AUC of 47 mg ⋅ h/liter), the F901318 Cmin and Cmin/MIC from the 8 strains were 0.27 mg/liter and 9.07, respectively. There was considerable strain-to-strain variability in the pharmacodynamics of F901318.

