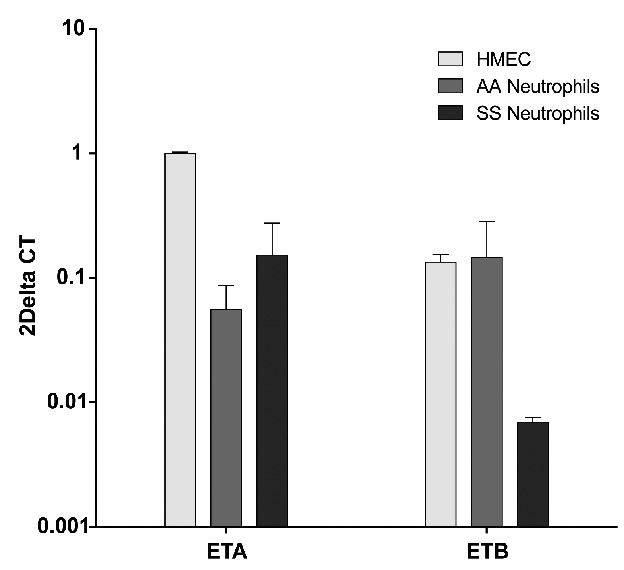
Figure 3.

Endothelial cells and neutrophils from both healthy controls (AA), and SCD patients (SS) express ETA and ETB transcripts. Results of real time quantitative reverse transcriptase polymerase chain reaction are expressed as a comparison with ETA/B mRNA transcripts in endothelial cells (HMEC-1) with the ΔΔCT method. The reference gene used was the β2 microglobulin gene. Results are means (± SEM) of eight independent samples (4 controls, 4 patients) in duplicate.
