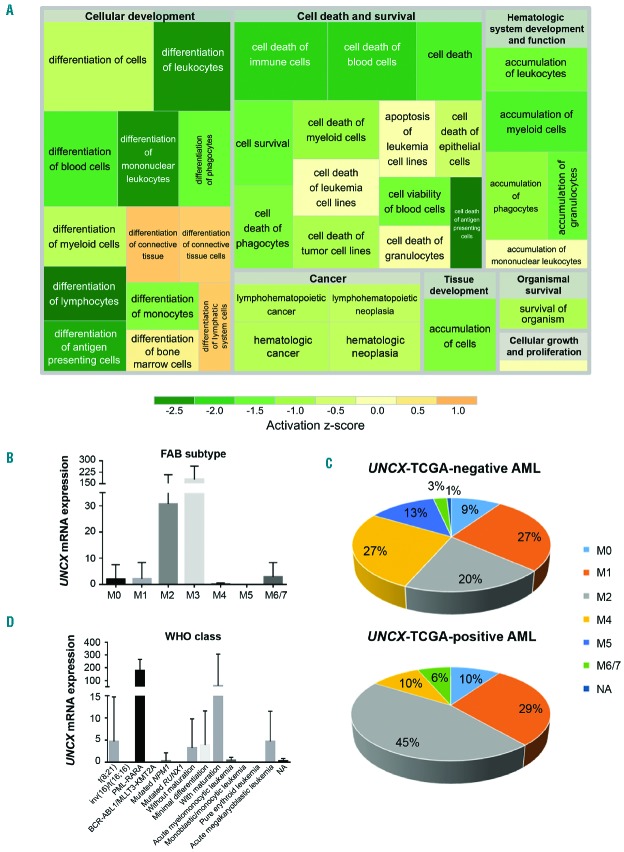
Figure 3.
Association analysis of TCGA acute myeloid leukemia (AML) cohort. (A) Treemap showing the activation state of the enriched processes for commonly differentially expressed genes between exon array and TCGA data; green: reduced activity, orange: enhanced activity. Higher significance levels for a process are reflected by a larger enclosing rectangle. (B and D) UNCX transcript levels were obtained by TCGA RNASeq data. (B) Mean value and standard deviation across FAB types are shown. UNCX expression was significantly higher in M3 cases compared with the other FAB subtypes (P<0.0001, except for M6/7). (C) Graph showing the distribution of UNCX-TCGA-positive and UNCX-TCGA-negative AML cases across FAB types (excluding M3). Percentages are reported in the graphs. (D) Mean value and standard deviation across World Health Organization (WHO) classes (here reported with abbreviations) are shown (AML with BCR-ABL1 and AML with t(9;11)(p21.3;q23.3); MLLT3-KMT2A are reported together due to low number of cases. UNCX expression was higher in acute promyelocytic leukemia (APL) with PLM-RARA and AML with t(8;21)(q22;q22.1); RUNX1-RUNX1T1.

