Figure 1.
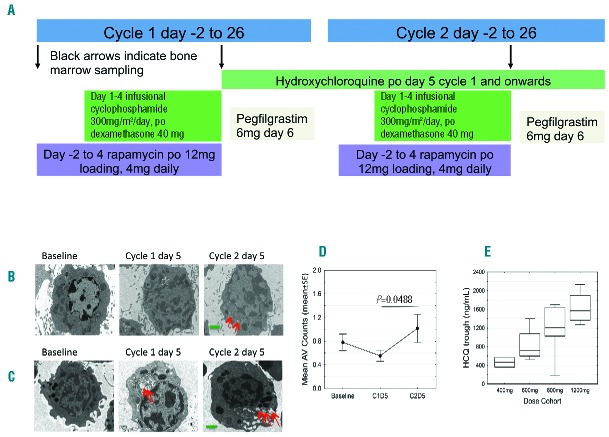
Treatment schema. (A) Treatment schema depicting the first 2 cycles of therapy. Black arrows indicate time points when bone marrow sampling occurred on the phase I trial. Patients received cyclophosphamide 300 mg/m2 daily as a continuous intravenous infusion and dexamethasone 40 mg daily by mouth (po) for four days, rapamycin po from cycle 1 day –2 (12 mg loading dose followed by 4 mg daily for 5 more days) AND hydroxychloroquine (HCQ) po from cycle 1 day 5 onwards (phase I trial), OR hydroxychloroquine (pilot trial). Hydroxychloroquine started at cycle 1 day 5 after rapamycin, alkylator and steroid exposure in order to analyze autophagy at baseline, after chemotherapy and before adding the hydroxychloroquine effect. Maximal autophagy inhibition was anticipated to occur after several weeks of daily hydroxychloroquine due to its long half life (32–50 days). Steady state rapamycin trough levels of 4 to 12 ng/mL were targeted with a loading dose of 12 mg and a daily dose of 4 mg. Due to limited single agent activity of mTOR inhibitors in multiple myeloma and a concern for ongoing immunosuppression, rapamycin duration was limited to six days in total each cycle. Pegfilgrastim 6 mg was administered subcutaneously 24–48 hours after completing cyclophosphamide each cycle. All cycles beyond were identical to cycle 2, repeated every 28 days. (B–D) Therapy-associated autophagy modulation in myeloma cells from patients receiving cyclophosphamide, dexamethasone, rapamycin, and hydroxychloroquine. Representative electron micrographs (EMs) from CD 138-selected bone marrow plasma cells from subjects at baseline; after six days of rapamycin plus four days of cyclophosphamide and dexamethasone on cycle 1 day 5; and on cycle 2 day 5 hydroxychloroquine (HCQ) has been taken for 28 days. EM, direct magnification 4800×, green scale bar: 1 μm. Red arrows indicate autophagic vesicles (AV). (B) Cohort 4 (1200 mg HCQ) subject EM. (C) Cohort 3 (800 mg HCQ) subject EM. (D) Therapy-associated autophagy modulation in myeloma cells from all patients treated. Mean AVs in bone marrow plasma cells. The mean AV difference between baseline and cycle 1 day 5 is 0.260 [standard error (SE) 0.148, P=0.0939], between baseline and cycle 2 day 5 is −0.098 (SE 0.171, P=0.5738) and between cycle 1 day 5 and cycle 2 day 5 is −0.358 (SE 0.171, P=0.0488). (E) Mean and range of hydroxychloroquine trough levels across the 4 dose cohorts. The graph shows the median (center line), 25th-75th percentiles [interquartile range (IRQ), box], and 5th-95th percentiles (IRQ whiskers).

