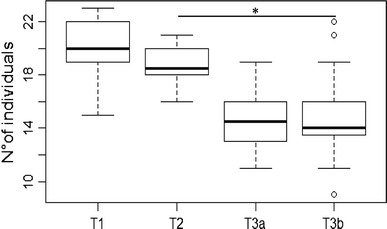
Fig. 2.

Number of individuals that contacted the boxes for all sessions in each task. Represented are median (black bars), interquartile range (boxes), upper and lower hinge (whiskers) and outliers (circles). Asterisks indicate significant differences with *P < 0.05
