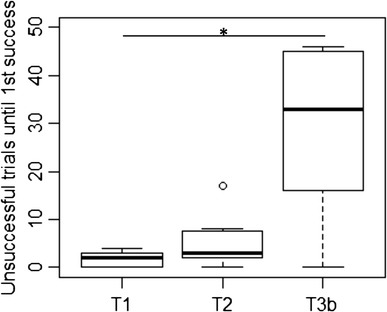
Fig. 3.

Number of unsuccessful trials until the first success in all three tasks (N = 7). Represented are median (black bars), interquartile range (boxes), upper and lower hinge (whiskers) and outliers (circles). Asterisks indicate significant differences with *P < 0.05
